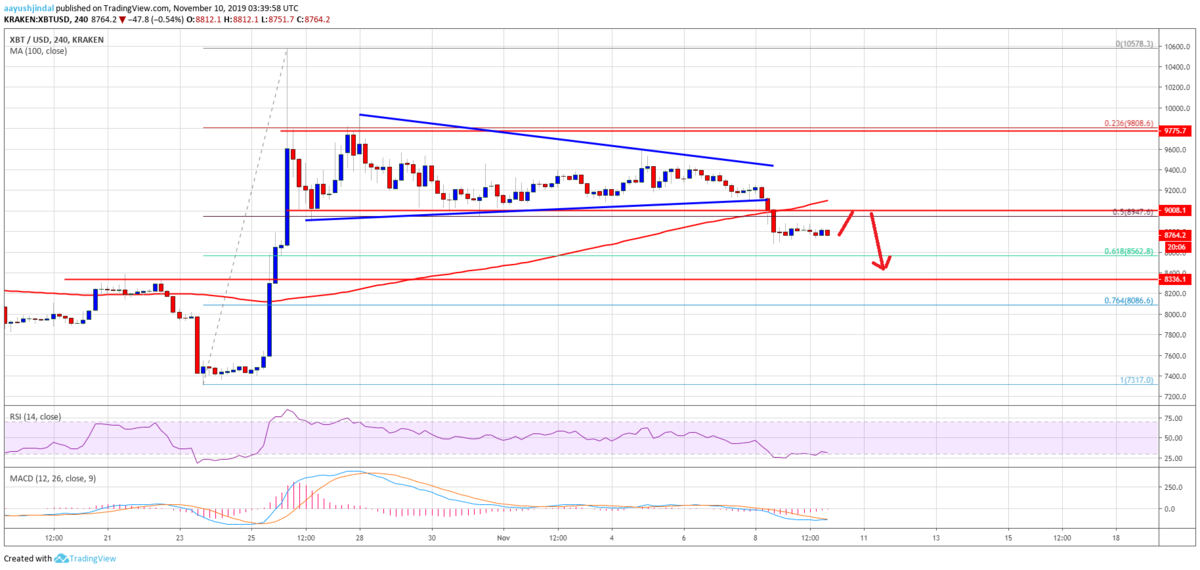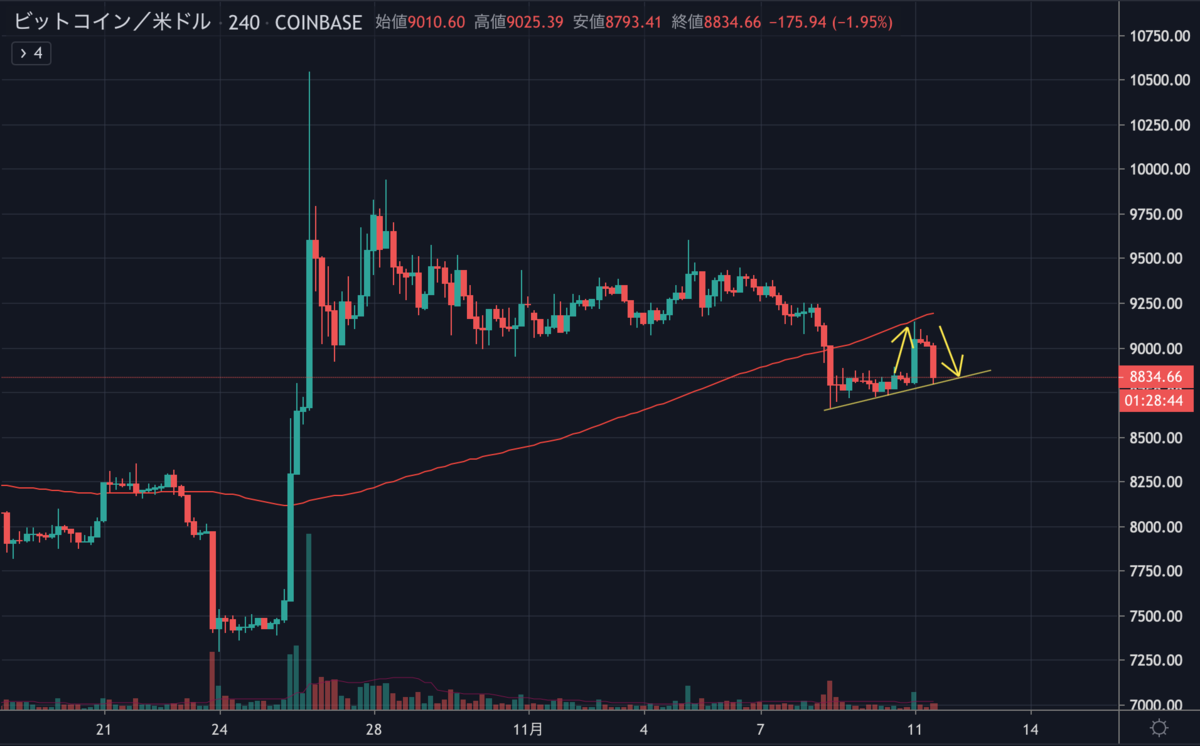
サポートラインを下抜けたビットコインは、急落後に少し回復したものの、現在は再び下落を再開しています。
昨日の値動きは、ほぼNEWS BTCの予想図通りになりました。

Bitcoin (BTC) Price Weekly Forecast: More Downsides Likely

今後もBTCは下落を続けるのでしょうか。
NEWS BTCでビットコインのチャート分析を見てみます。
ビットコインのチャート分析
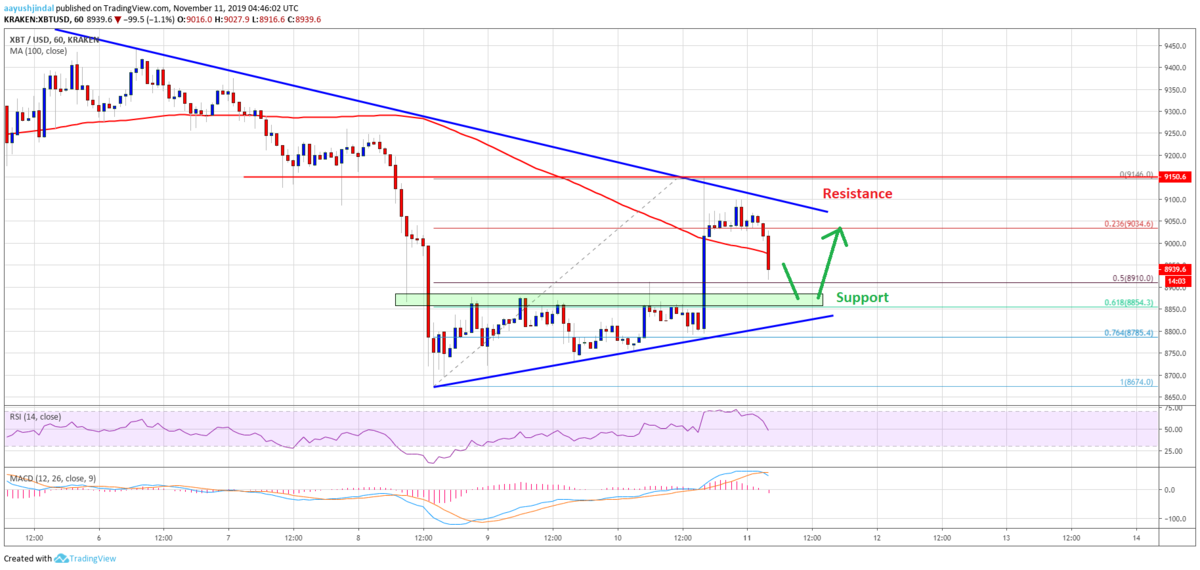
An immediate support on the downside is near the $8,900 level. It represents the 50% Fib retracement level of the recent wave from the $8,674 low to $9,146 high. The main support is near the $8,860 and $8,840 levels.
下落時の直近のサポートは8,900ドル付近です。これは、最近の波(8,674ドル〜9,146ドル)の50% Fibリトレースメントレベルになります。メインサポートは8,860ドルと8,840ドル付近になります。

More importantly, there is a connecting bullish trend line forming with support near $8,840 on the hourly chart of the BTC/USD pair.
さらに重要なのは、BTC/USDペアの時間足チャートに、8,840ドル付近でサポートとなる上昇トレンドラインが形成されていることです。
On the upside, the price is facing hurdles near the $9,100 and $9,150 levels. Besides, there is a key bearish trend line forming with resistance near $9,100 on the same chart.
上昇時は9,100ドルと9,150ドル付近にハードルがあります。さらに、同チャート上には、9,100ドル付近でレジスタンスとなる重要な下降トレンドラインが形成されています。
Looking at the chart, bitcoin seems to be struggling to continue above $9,100. If it continues to struggle, there is a risk of another bearish wave below the $8,800 level in the near term.
チャートを見ると、ビットコインは9,100ドル以上で留まり続けることに苦戦しているようです。このまま苦戦が続けば、短期的には8,800ドルを下回る新たな下落の恐れがあります。
via: Bitcoin (BTC) Price Rebound Facing Key Resistance Near $9,100
_


