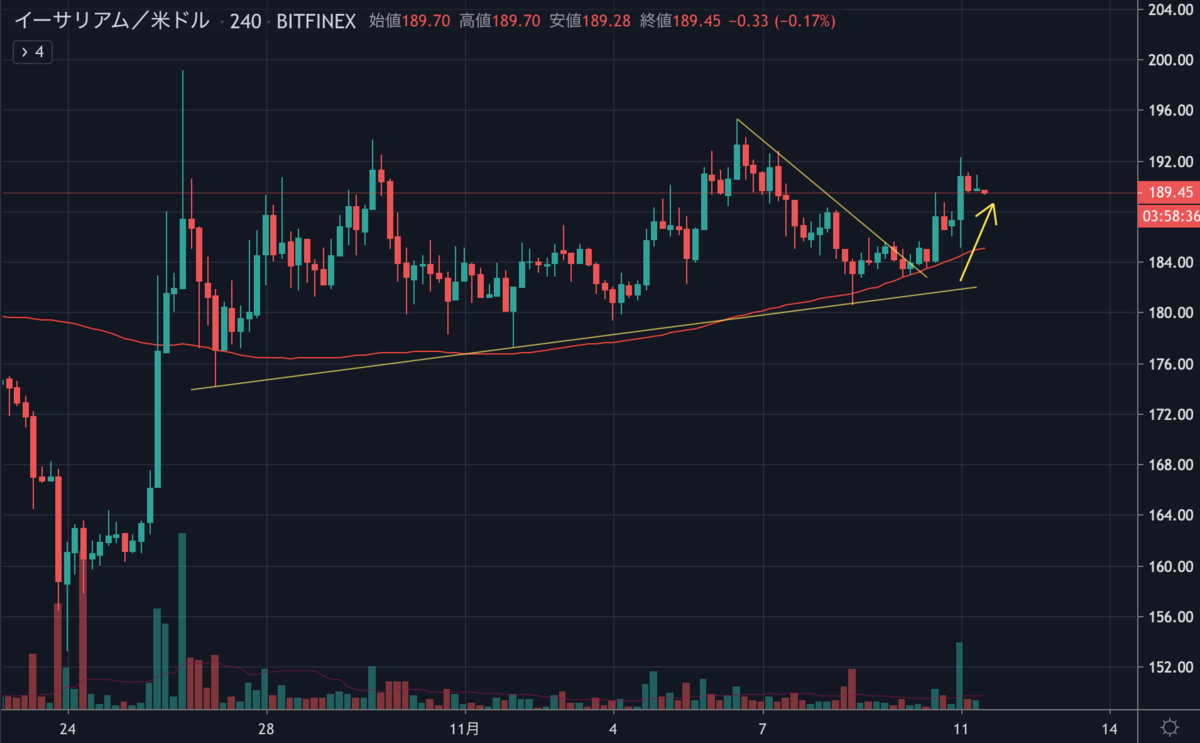
イーサリアムが上昇を始めました。
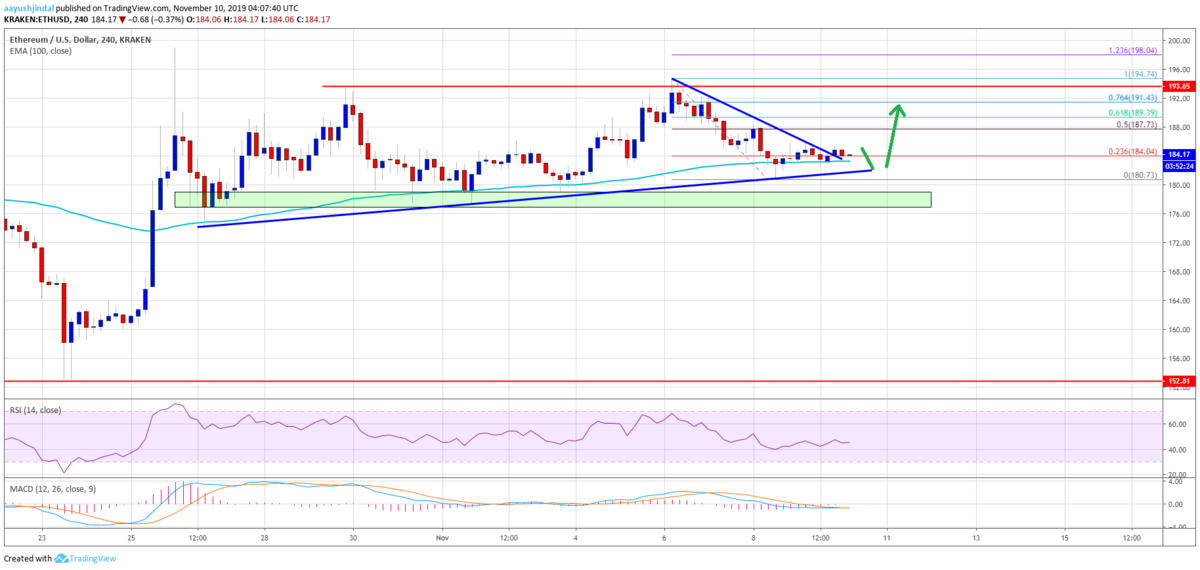
昨日はスルーしていたのですが、NEWS BTCに投稿されていた予想図は的中していたようです。むむ。

Ethereum Price Weekly Forecast: ETH Holding Uptrend Support

気を取り直して、イーサリアムの今日のチャート分析をNEWS BTCで見てみます。
イーサリアムのチャート分析
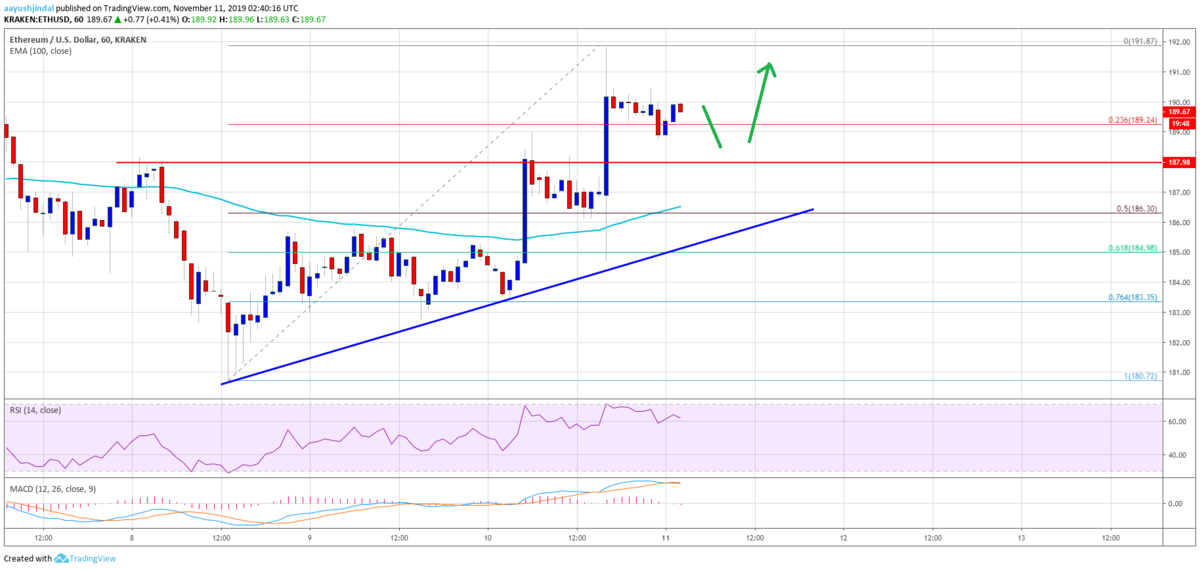
On the downside, there are many key supports for Ethereum near the $188 and $186 levels. Additionally, there is a key bullish trend line forming with support near $186 on the hourly chart of ETH/USD.
下落する場合は、188ドルと186ドル付近に多くの重要なサポートがあります。さらに、ETH/USDの時間足チャートには、186ドル付近でサポートとなる重要な上昇トレンドラインが形成されています。

The 50% Fib retracement level of the recent wave from the $180 swing low to $192 high is also near the $186 level to provide support. Besides, the 100 hourly simple moving average is showing positive signs near the $186 level.
最近の波(180ドル〜192ドル)の50% Fibリトレースメントレベルも186ドル付近でサポートになっています。また、186ドル付近で100時間SMA(単純移動平均線)がポジティブサインを示しています。
On the upside, an immediate resistance is near the $192 level. However, the main resistance is near the $195 level, above which the price is likely to test the $200 resistance area in the near term.
上昇時の直近のレジスタンスは192ドル付近です。しかし、メインレジスタンスは195ドル付近で、それを上抜けると短期的に200ドルのレジスタンスを試す可能性が高くなるでしょう。
Looking at the chart, Ethereum price is showing decent recovery signs above the $186 and $188 levels. Having said that, bitcoin is facing a strong resistance near $9,100. If BTC clears $9,100, there could be another upward move in ETH above the $192 and $195 resistance levels.
チャートを見ると、イーサリアムの価格は186ドルと188ドルの水準を上回り、堅実な回復のサイン示しています。とはいえ、ビットコインは9,100ドル付近で強いレジスタンスに直面しています。もしBTCが9,100ドルを突破すれば、ETHの新たな上昇が始まり192ドルと195ドルを突破する可能性があります。
via: Ethereum (ETH) Recovering Nicely While Bitcoin Runs Into Resistance
_


