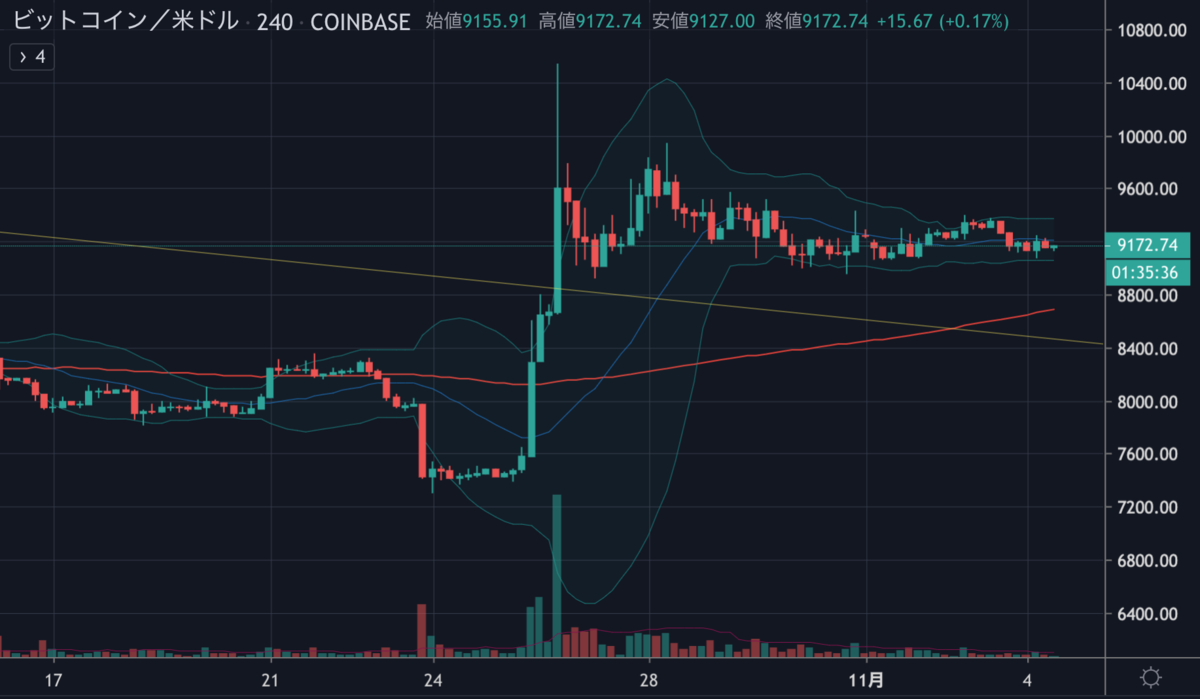
ビットコインは引き続きレンジ相場で取引されており、現在は9,150ドル付近を推移しています。

最近は、仮想通貨取引所バイナンスのCEOがビットコインの1万6000ドル予想をするなど、強気な見方をしているアナリストも多数いるようです。
レンジブレイクから上昇トレンドへの移行はあり得るのでしょうか。
NEWS BTCでビットコインのチャート分析を見てみます。
ビットコインのチャート分析
It seems like the 50% Fib retracement level of the recent decline from the $9,393 high to $9,081 low is acting as a resistance for the bulls. If there are more gains, the $9,300 area is likely to act as a major hurdle in the near term for bitcoin.
最近の下落(9,393ドル〜9,081ドル)の50% Fibリトレースメントレベルがレジスタンスとして機能しているようです。これを超えて上昇する場合は、9,300ドル台が短期的に大きな障害として機能するでしょう。

If there is an upside break above the $9,300 resistance, the next stop for the bulls may perhaps be near the $9,380 and $9,400 resistance levels. Conversely, if there is a downward move, an initial support is near the $9,100 level. The main support is near the $9,000 level, below which there is a risk of another decline towards $8,500.
9,300ドルのレジスタンスを突破すれば、おそらく9,380ドルと9,400ドルのレジスタンスレベルが次のターゲットになるでしょう。逆に、下落の動きがあれば、最初のサポートは9,100ドル付近になります。メインサポートは9,000ドル付近、これを下抜けると再び8,500ドルに向けて下落する恐れがあります。
Looking at the chart, bitcoin is clearly facing a lot of resistances near the $9,300 and $9,400 levels. A successful close above the $9,400 level is must for bullish acceleration. If not, there is a risk of a downside extension below the $9,000 support.
チャートを見ると、ビットコインは明らかに9,300ドルと9,400ドル付近で多くのレジスタンスに直面しています。上昇を加速させるには9,400ドル以上で引ける必要があります。それができない場合は、9,000ドルのサポート以下まで下落が拡大する恐れがあります。
via: Bitcoin (BTC) Price Stable Above $9K But Can It Climb Again?


