ここ数日のビットコインは依然として狭い値幅でもみ合っていますが、昨日から今日にかけてはやや上昇しているようにも見えます。
記事執筆時点では9,300ドル付近で取引されているBTCの今後の値動きはどのように予想されるのでしょうか。
NEWS BTCでビットコインのチャート分析(週間予想)を見てみます。
ビットコインのチャート分析
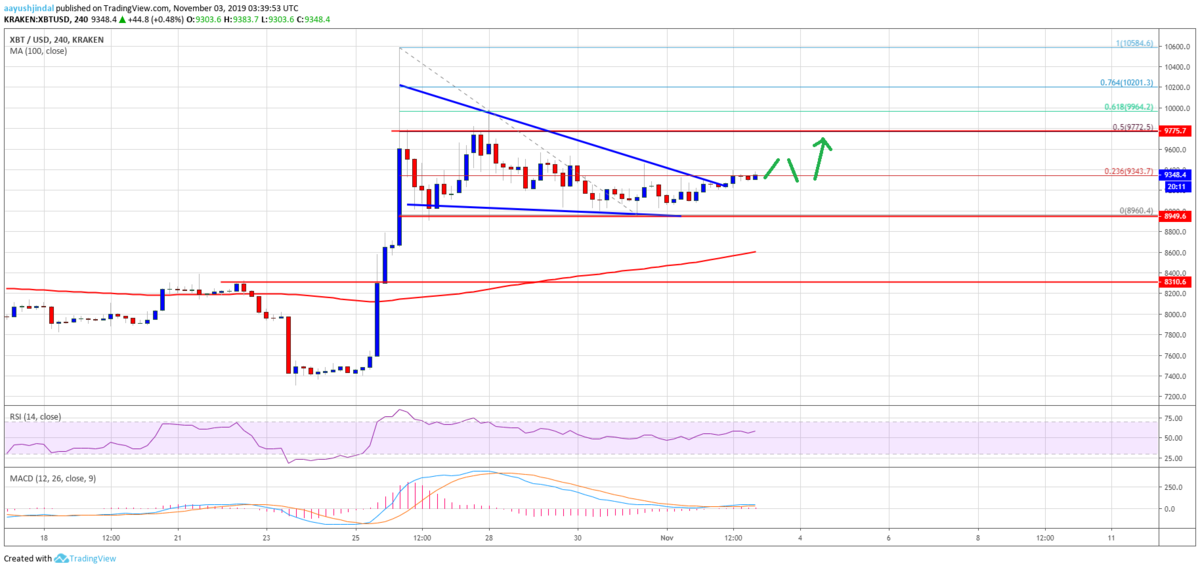
At the moment, the price is trading near the 23.6% Fib retracement level of the downward move from the $10,584 high to $8,960 low.
現在は、下落の動き(10,584ドル〜8,960ドル)の23.6% Fibリトレースメントレベル付近で取引されています。

If there are more gains, the price could continue to rise towards the $9,500 and $9,600 resistance levels. Besides, the main resistance is near the $9,770 level.
さらに上昇する場合は、9,500ドルと9,600ドルのレジスタンスレベルに向けて上昇を続ける可能性があります。また、メインレジスタンスは9,770ドル付近です。
On the downside, there are many supports between $9,200 and $8,960. If there is a bearish break below the $8,960 swing low, there are chances of a sharp decline. The next key support is near $8,600 and the 100 simple moving average (4-hours).
下落する場合は、9,200ドルから8,960ドルの間に多くのサポートがあり、8,960ドルを下抜けると急落する可能性があります。次の重要なサポートは、8,600ドルと100期間SMA(4時間)の付近です。
Therefore, the $8,500 and $8,600 support levels are likely to play an important role. As long as the price is above the $8,500 support, there are chances of a fresh increase above the $9,500 level.
したがって、8,500ドルと8,600ドルのサポートレベルが重要な役割を果たすでしょう。価格が8,500ドルのサポートを超えている限り、9,500ドル水準を突破する新たな上昇の可能性があります。
Looking at the chart, bitcoin price is clearly showing signs of bullish continuation above $9,500. Having said that, a clear break above the $9,500 and $9,770 resistance levels is needed for uptrend acceleration. In the mentioned case, the price is likely to revisit $10,580.
チャートを見ると、ビットコインの価格は明らかに9,500ドルを超える強気継続サインを見せています。とはいえ、上昇を加速させるには9,500ドルと9,770ドルのレジスタンスをはっきりと超える必要があります。その場合、価格は再び10,580ドルになる可能性が高いでしょう。
via: Bitcoin (BTC) Price Weekly Forecast: Signs of Bullish Continuation
_


