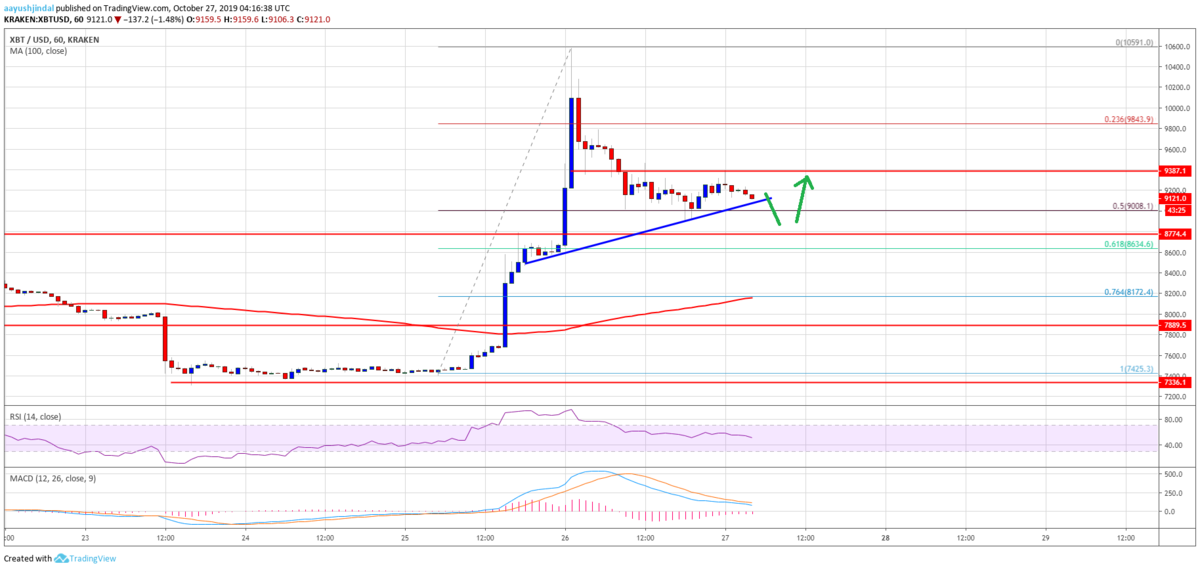
ビットコインの価格は、先日の爆上げ後に少し調整したものの、その後は再び上昇しつつあります。

Bitcoin (BTC) Price Weekly Forecast: Is This Real Bullish Break?

現在は9,500ドル付近で取引されていますが、ここから上昇が再開すると再び1万ドルを突破するかもしれません。
チャート分析では、今後の値動きはどのように予想されるのでしょうか。
ビットコインのチャート分析
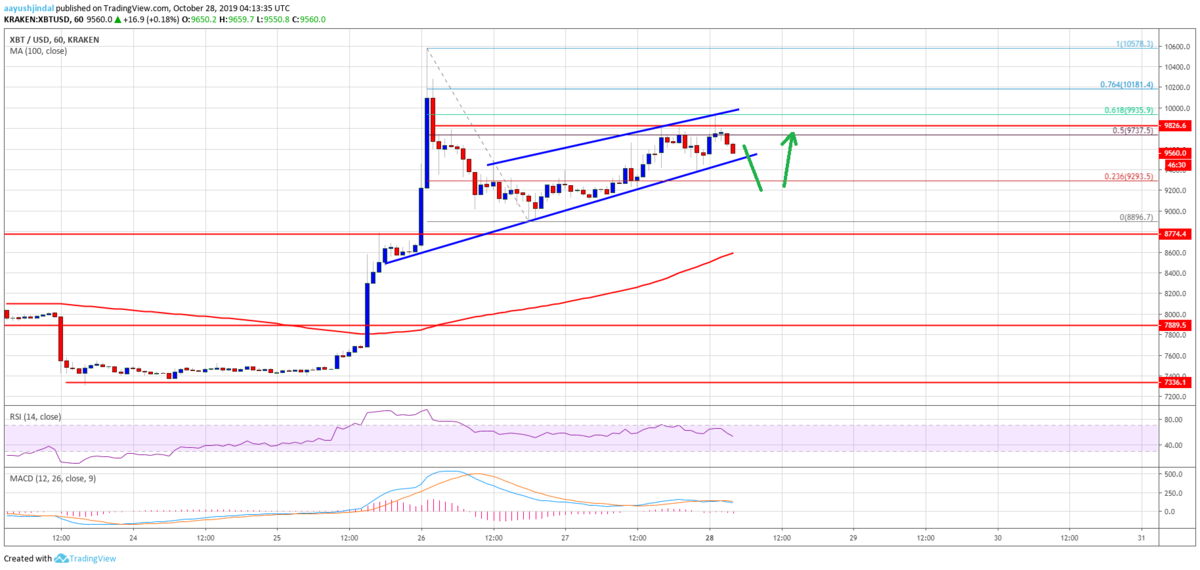
At the moment, the price is declining and is moving towards the $9,500 support. More importantly, there is a crucial bullish trend line forming with support near $9,500 on the hourly chart of the BTC/USD pair.
現在、価格は下落しており、9,500ドルのサポートに向かって動いています。さらに重要なのは、BTC/USDペアの時間足チャートに、9,500ドル付近でサポートとなる重要な上昇トレンドラインが形成されていることです。

If there is a downside break below the trend line, the price could extend its downward correction towards the $9,200 level. Any further losses may perhaps push bitcoin price towards the $8,750 support area.
このトレンドラインを下抜けると、価格は9,200ドルの水準に向けてさらに調整する可能性があります。さらに下落する場合は、ビットコインのは8,750ドルのサポートエリアを目指すかもしれません。
Conversely, if the price continues to climb higher, it could climb above the $9,850 and $9,900 resistance. The main hurdle is near the $10,000 level, above which the price is likely to climb towards $10,500.
逆に、価格の上昇が続けば、9,850ドルと9,900ドルのレジスタンスを突破する可能性もあります。メインのハードルは10,000ドル付近で、これを上抜けると10,500ドルに向けて上昇する可能性が高いでしょう。
Looking at the chart, bitcoin is showing a lot of positive signs above the $9,500 and $9,200 levels. However, there are a few chances of anther downward move towards $9,200 or $9,000 to complete the correction. Once the price completes the current correction, it is likely to surge above $10,000 or even $10,500.
チャートを見ると、ビットコインは9,500ドルと9,200ドルの水準以上で多くのポジティブサインを示しています。しかし、9,200ドルまたは9,000ドルに向けて下落し調整を完了する可能性もあります。この調整が完了すれば、10,000ドルや場合によっては10,500ドルを超える可能性が高くなります。
via: Bitcoin (BTC) Price Steadies Uptrend But Another Correction Likely
_


