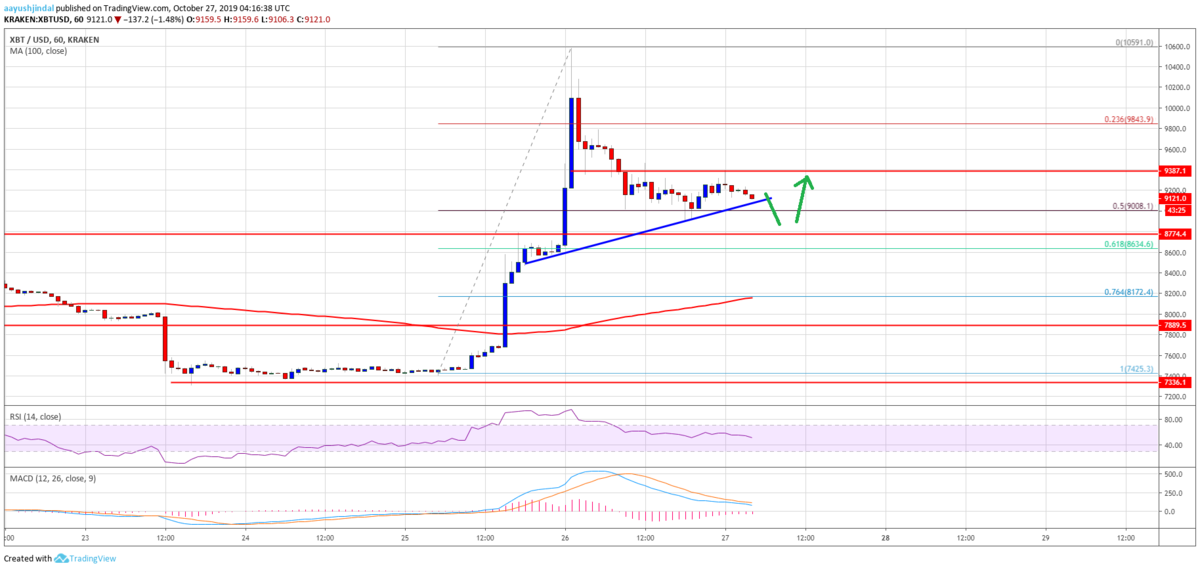
先週は7,400ドル付近で停滞していたビットコインが暴騰し、わずか数時間で1万ドル以上まで回復しました。
その後は9,000ドル以下まで価格を戻しています。
今回の高騰要因は、中国の習近平国家主席の発言を受けて買いが殺到したのではないかと見られています。これが一時的な高騰で終わるのか、それともこのまま上昇トレンドに転換する可能性もあるのでしょうか。
NEWS BTCでビットコインのチャート分析を見てみます。
ビットコインのチャート分析
Besides, the price traded below $9,500 and tested the $9,000 support area. Besides, it seems like the 50% Fib retracement level of the rally from the $7,425 swing low to $10,591 high is currently acting as a strong support.
価格は9,500ドル以下で取引され、9,000ドルのサポートエリアを試しました。さらに、今回の急騰(7,425ドル〜10,591ドル)の50% Fibリトレースメントレベルが現在は強力なサポートとして機能しているようです。

More importantly, there is a short term bullish trend line forming with support near $9,080 on the 4-hours chart of the BTC/USD pair. If there is a downside break below the trend line and $9,000, bitcoin price could test the next major support near the $8,600 area.
さらに重要なのは、BTC/USDペアの4時間足チャートで短期的な上昇トレンドラインが形成されており、9,080ドル付近でサポートになっていることです。このトレンドラインと9,000ドルを下抜けた場合、ビットコインの価格は8,600ドル付近の次の強いサポートを試す可能性があります。
The $8,600 and $8,500 levels are crucial supports since they acted as hurdles previously.
8,600ドルと8,500ドルは、これまでハードルとして機能してきたため、極めて重要なサポートです。
Therefore, the $8,500 support is likely to act as a major support. If the price fails to stay above $8,500, it could move back into a downtrend.
したがって、8,500ドルのサポートが強いサポートとして機能することが見込まれます。もし8,500ドル以上で維持できなければ、再び下降トレンドに戻る可能性があります。
via: Bitcoin (BTC) Price Weekly Forecast: Is This Real Bullish Break?
_


