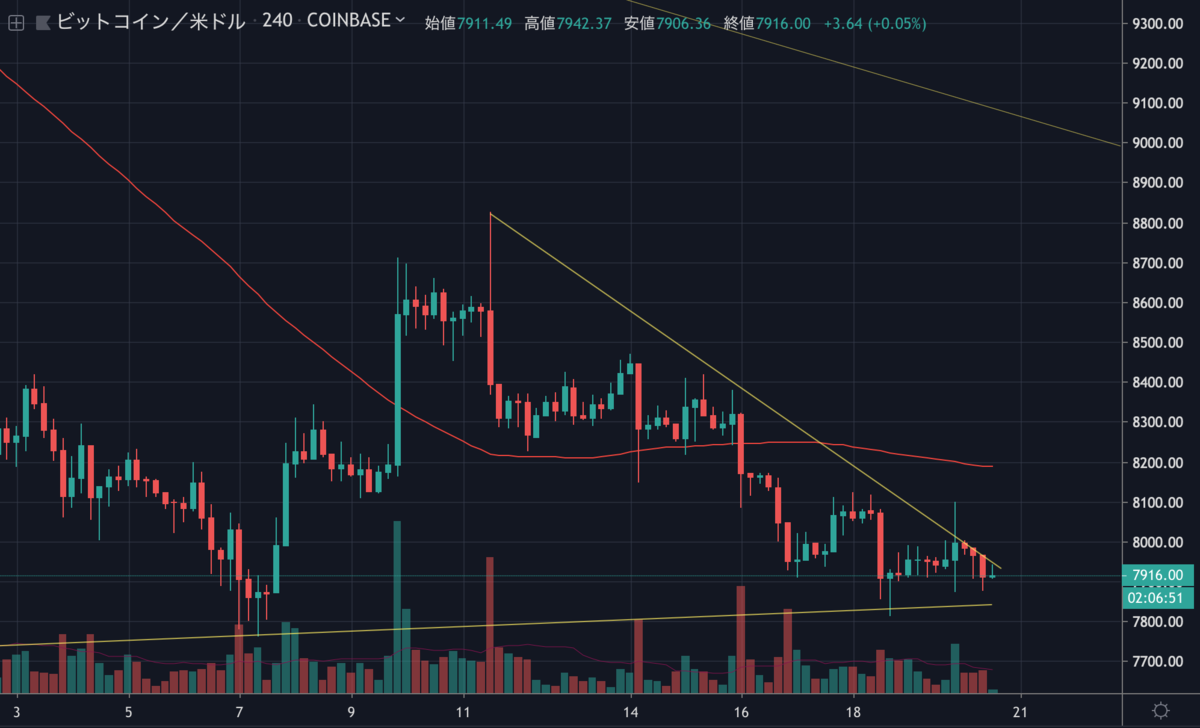
8,000ドルを下抜けたビットコインは、まだ回復することなく低迷を続け、現在は7,900ドル付近で取引されています。

BTCのチャートは、ここ数日間で三角保ち合いを形成しており、そろそろ上下のどちらかに抜けそうな雰囲気です。
今後の値動きはどのように予想されるのでしょうか。
NEWS BTCでビットコインのチャート分析を見てみます。
ビットコインのチャート分析
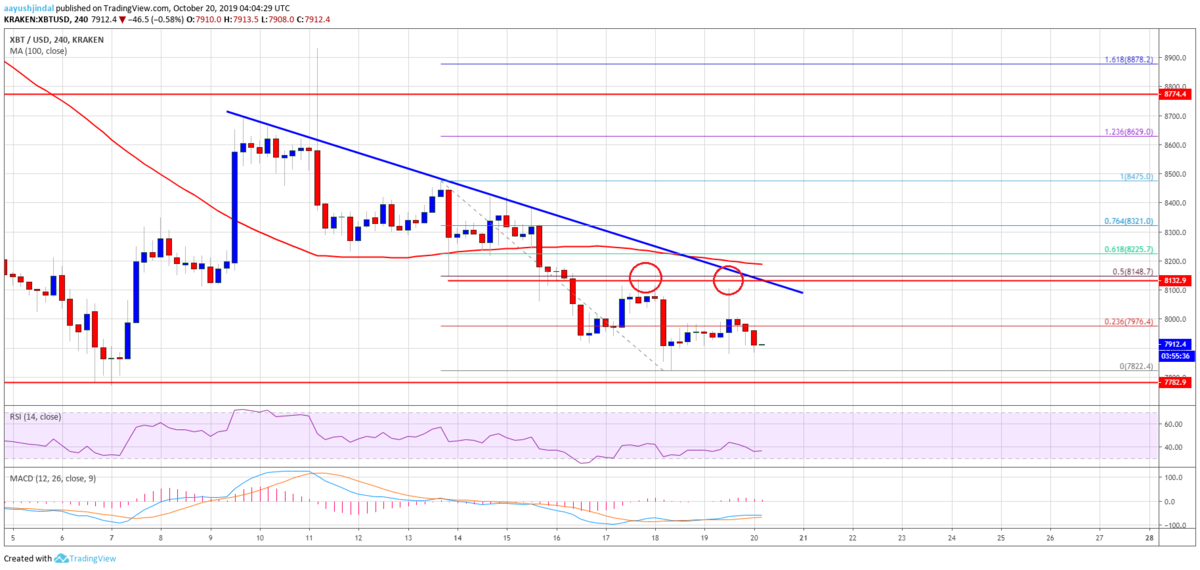
An immediate resistance is near the $8,000 level or the 23.6% Fib retracement level of the recent decline from the $8,475 swing high to $7,822 low. On the upside, there are many hurdles near the $8,100 and $8,200 levels. Moreover, there is a major bearish trend line forming with resistance near $8,100 on the 4-hours chart of the BTC/USD pair.
直近のレジスタンスは8,000ドル付近、または最近の下落(8,475ドル〜7,822ドル)の23.6% Fibリトレースメントレベル付近になります。上昇時は、8,100ドルと8,200ドル付近に多くのハードルがあります。さらに、BTC/USDペアの4時間足チャートには、8,100ドル付近でレジスタンスとなる大きな下降トレンドラインが形成されています。

On the downside, the key support is near the $7,800 level. If there is a downside break below the $7,800 support, the price could continue to decline in the near term. The next major support is near the $7,500 level, below which there is a risk of more losses towards $7,200.
下落時の重要なサポートは7,800ドル付近になります。7,800ドルのサポートを下抜けると、価格は短期的に下落を継続するでしょう。次の大きなサポートは7,500ドル付近で、これを下抜けると7,200ドルに向けてさらに下落するリスクがあります。
Looking at the chart, bitcoin price is clearly trading in a bearish zone below the $8,000 pivot level and the $8,200 resistance. Therefore, a convincing break above $8,000 and a follow through above $8,200 is required for a strong recovery. If not, the price is likely to test the $7,500 support area.
チャートを見ると、ビットコインの価格は明らかに8,000ドルと8,200ドルのレジスタンスを下回り、弱気ゾーンで取引されています。そのため、強く回復するには、8,000ドルをはっきりと上抜けて8,200ドルを超えるまで上昇する必要があります。それができなければ、7,500ドルのサポートエリアを試す可能性が高いでしょう。
via: Bitcoin (BTC) Price Weekly Forecast: Vulnerable Below $8K-$8.2K
_


