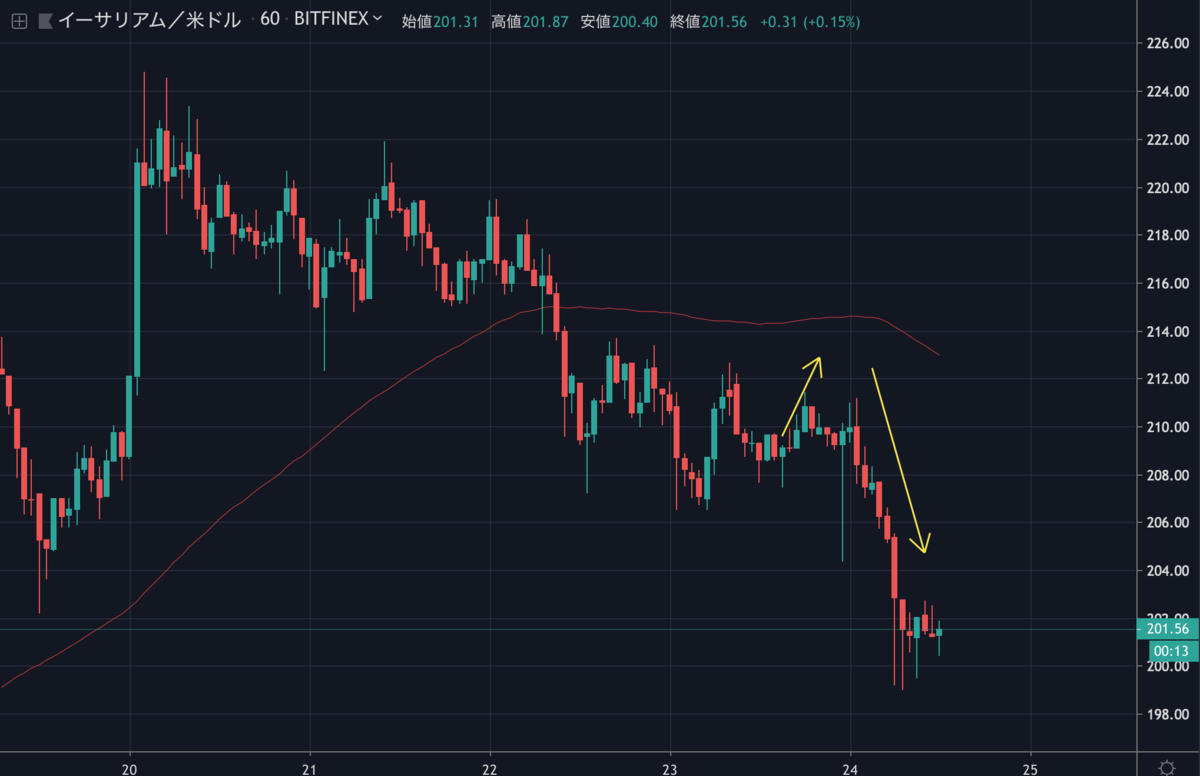
ビットコインが下落を始め、しばらく耐えていたイーサリアムも現在は下落傾向にあるようです。
チャートは昨日のNEWS BTC先輩の予想図通りの形になりました。

Ethereum (ETH) Price Could Retest $200 Before Fresh Increase

今後も下落を続ける可能性があるため、売却のタイミングを逃した方は注意が必要でしょう。
NEWS BTCでイーサリアムのチャート分析を見てみます。
イーサリアムのチャート分析
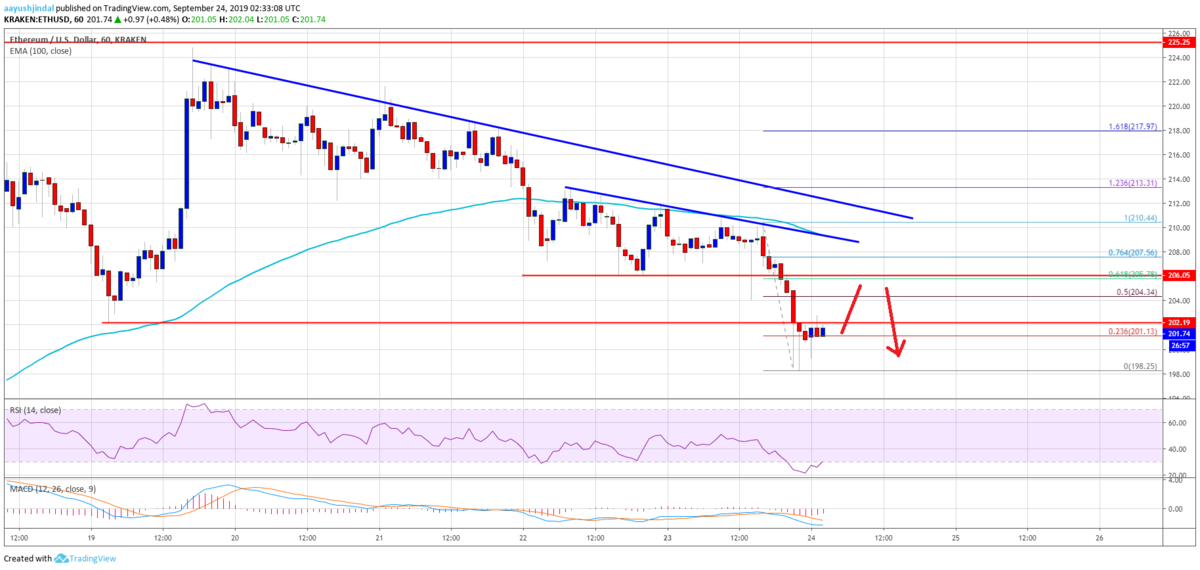
The main resistance is near the first trend line, the 100 hourly SMA, and $208. If there is an upside break above $208 and $210, Ethereum price will most likely move back into a positive zone. The next key resistance is near the $220 level, above which it could retest $225.
主なレジスタンスは、最初のトレンドラインと100時間SMA(単純移動平均線)、および208ドル付近になります。208ドルと210ドルを上抜けるブレイクがあれば、イーサリアムの価格はポジティブゾーンに戻る可能性が高くなります。次の重要なレジスタンスは220ドル付近、これを上抜けると再び225ドルを試す可能性があります。

Conversely, if the price fails to surpass the $208 and $210 resistance levels, it might continue to decline. An immediate support is near the $198 low. If there is a downside break below $198, the price is likely to test the $195 and $192 support levels.
逆に、208ドルと210ドルの突破に失敗すると下落を続ける可能性があります。直近のサポートは安値の198ドル付近。198ドルを下抜けると、195ドルと192ドルのサポートを試すでしょう。
Looking at the chart, Ethereum price is clearly declining and is trading below a few key resistances such as $208 and $210. As long as the price is trading below the $210 support, there are chances of a downside extension towards the $192 level.
チャートを見ると、イーサリアムの価格は明らかに下落しており、208ドルや210ドルといった主なレジスタンス以下で取引されています。価格が210ドルのサポートを下回っている限り、192ドル台に向けて下落する可能性があります。
via: Ethereum (ETH) Price Smashes Support, More Downsides Possible
_


