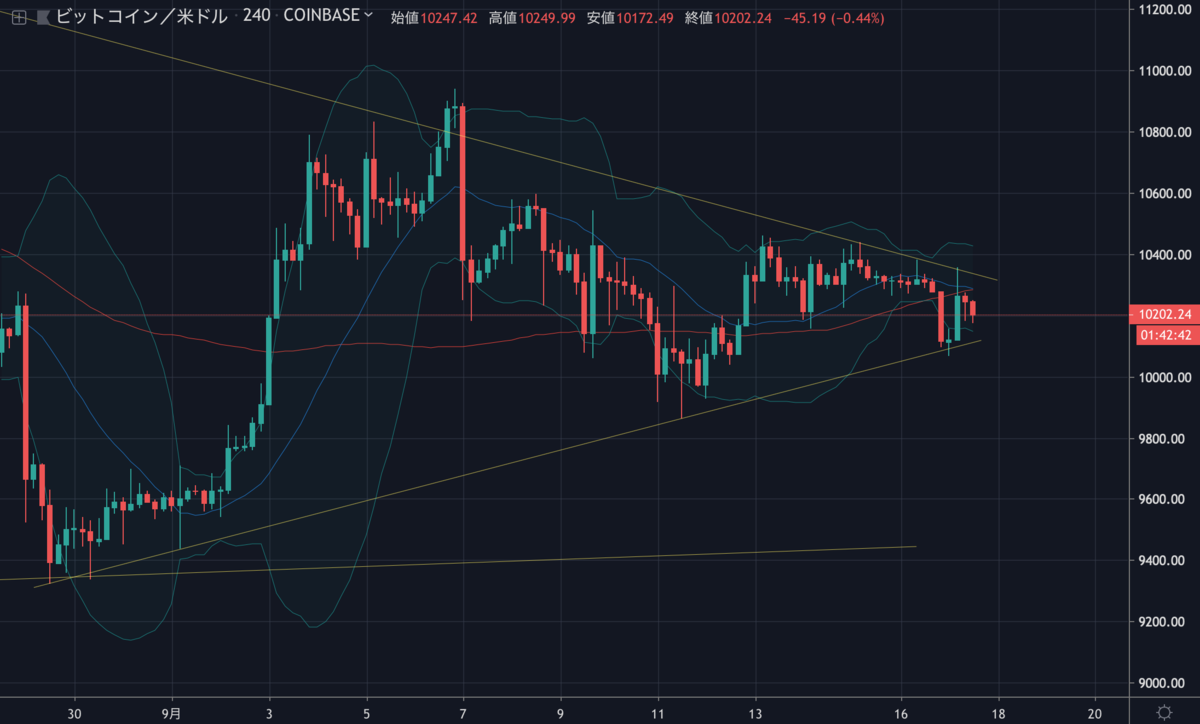
昨日のビットコインは10,000ドル付近まで急落したものの、きっちりサポートラインに反発し、現在も三角保ち合いの範囲内で取引されています。

そろそろどちらかにブレイクしそうな時期にあるBTCですが、今後の値動きはどのように予想されるのでしょうか。
NEWS BTCのチャート分析を見てみます。
ビットコインのチャート分析
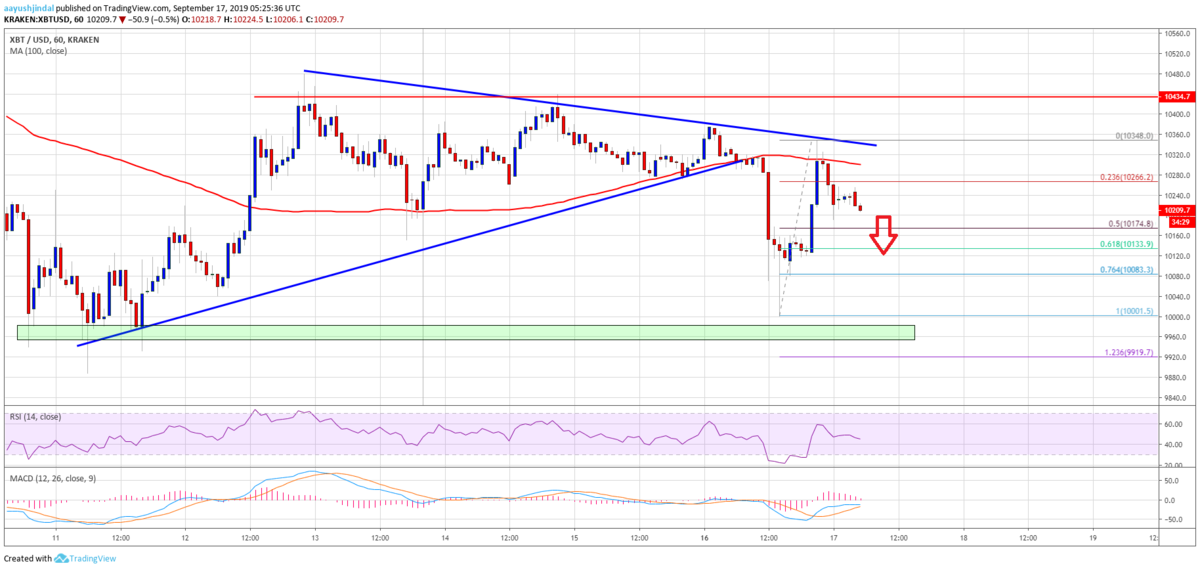
On the downside, an immediate support is near the $10,175 level. It represents the 50% Fib retracement level of the recent recovery from the $10,000 swing low to $10,348 high. The main supports on the downside are near the $10,000 and $9,900 levels.
下落時の直近のサポートは10,175ドル付近。これは、最近の回復(10,000ドル〜10,348ドル)の50% Fibリトレースメントレベルになります。主なサポートは10,000ドルと9,900ドル付近になります。

On the upside, there are many resistances near the $10,300, $10,350 and $10,400 levels. The main resistance is still near the $10,500 level. A successful break above the $10,400 level and a follow through above $10,500 is needed for upside acceleration in the near term.
上昇時は、10,300ドル、10,350ドル、10,400ドル付近に多くのレジスタンスがあります。主なレジスタンスはまだ10,500ドル付近です。短期的に上昇を加速するには、10,400ドルと10,500ドルを突破する必要があります。
Looking at the chart, bitcoin price is trading in a bearish zone below the $10,300 and $10,400 levels. Therefore, there is a risk of more downsides below $10,200. It seems like the price may perhaps revisit the $10,000 support.
チャートを見ると、ビットコインの価格は10,300ドルと10,400ドルを下回り弱気ゾーンで取引されています。そのため、10,200ドルを下回りさらに下落する恐れがあります。価格は10,000ドルのサポートまで戻りそうに見えます。
via: Bitcoin Price (BTC) At Clear Risk of Further Declines
_


