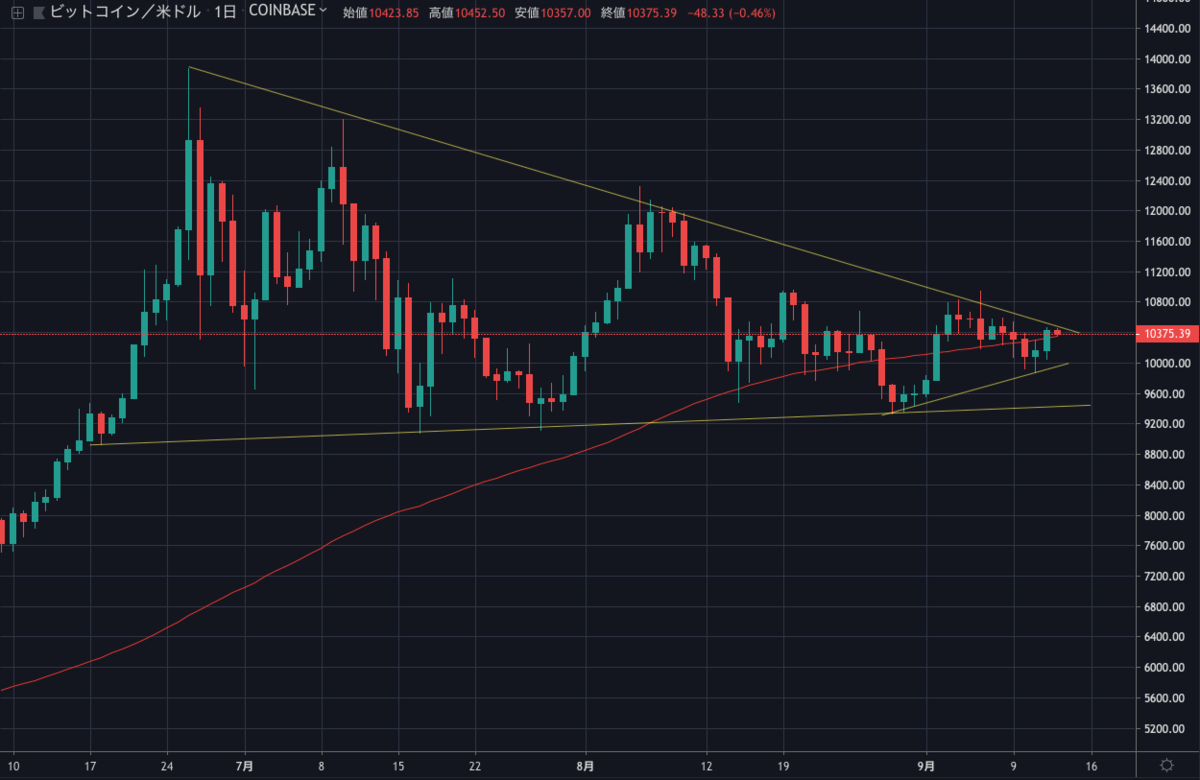
ここ数日10,000ドル前後を行ったり来たりしていたビットコインは、昨日17時頃から上昇を始めました。
しかし、日足チャートには大きな下降トレンドラインがあり、BTCの上昇が妨げられています。

長らく続いてきた三角保ち合いも頂点に近付き、いよいよどちらかに大きく動きそうな状況になってきました
今後の値動きはどのように予想されるのでしょうか。
NEWS BTCのチャート分析を見てみます。
ビットコインのチャート分析
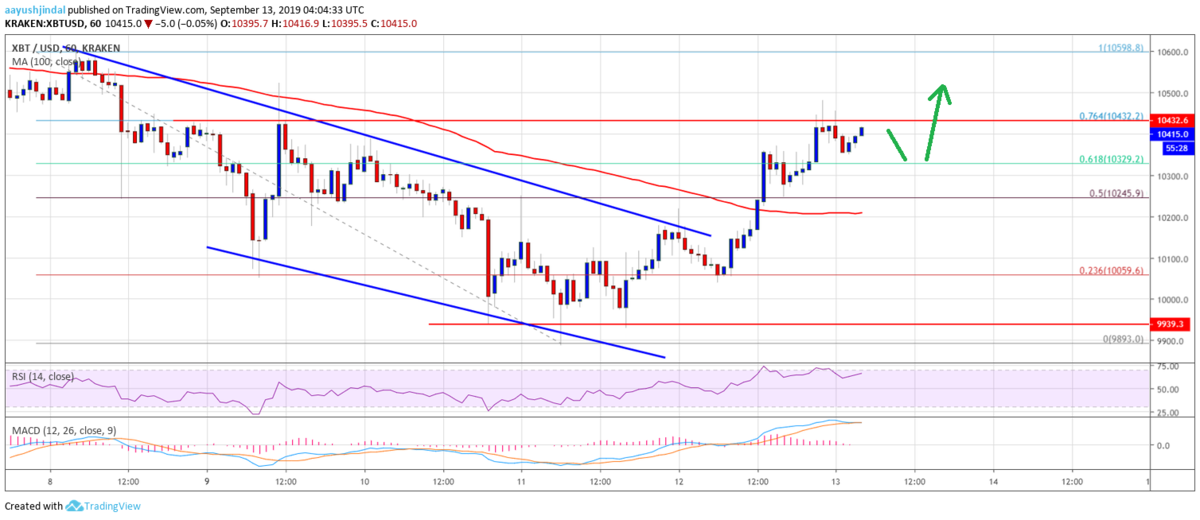
If there is an upside break above $10,450 and $10,500, the price could continue to rise in the coming sessions. In the mentioned case, the price is likely to gain momentum above the $10,590 and $10,600 levels.
10,450ドルと10,500ドルを上抜けた場合、今後の価格は上昇を続ける可能性があります。その場合、10,590ドルと10,600ドルレベル以上まで上昇の勢いを付けると思われます。

Conversely, if there is a downside correction, the price could test the $10,200 support area.
逆に、下方修正があれば、価格は10,200ドルのサポートエリアを試す可能性があります。
If there a close below the 100 hourly SMA, the price is likely to resume its decline and revisit the $10,000 support area. More importantly, a convincing close below the $10,000 support might start a strong decline in the coming sessions.
100時間SMA(単純移動平均線)を下回れば、再び下落が始まり10,000ドルのサポートエリアまで戻る可能性が高くなります。さらに重要なのは、10,000ドルのサポートをはっきりと下回って引けた場合、今後強い下落が始まる恐れがあることです。
Looking at the chart, bitcoin price is trading with a positive bias above the $10,200 level and the 100 hourly SMA. Therefore, there are chances of a decent rise above the $10,450 and $10,500 level. Conversely, only a close below $10,200 might spark fresh bearish moves.
チャートを見ると、ビットコインの価格は10,200ドルと100時間SMAを上回りポジティブバイアスで取引されています。そのため、10,450ドルと10,500ドルレベルを超えて大きく上昇する可能性があります。逆に、10,200ドル以下で引ける場合のみ、新たな下落を始めるでしょう。
via: Bitcoin Price (BTC) Rebounding But Can Bulls Overcome $10,500?
_


