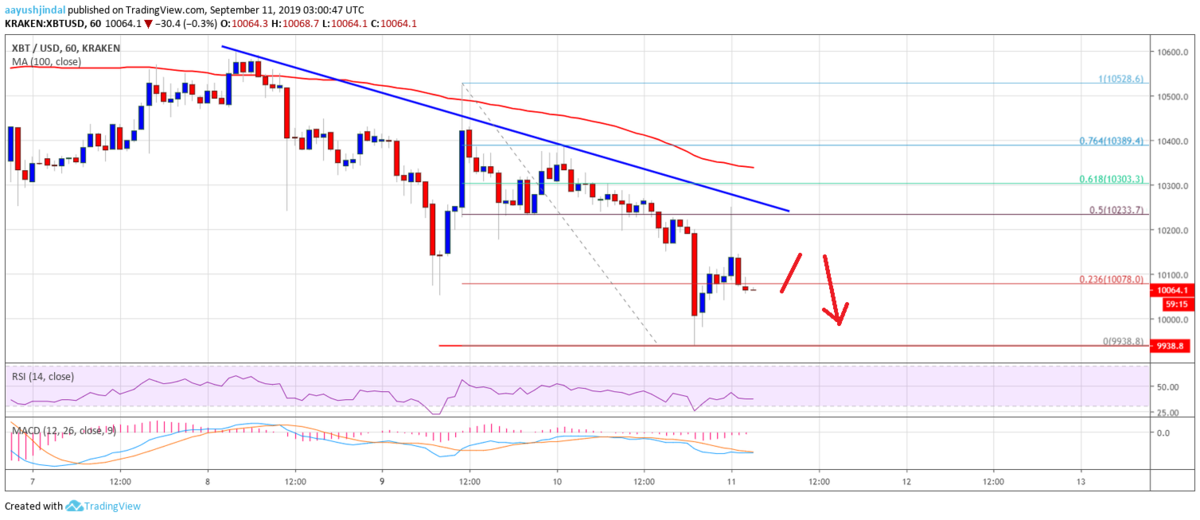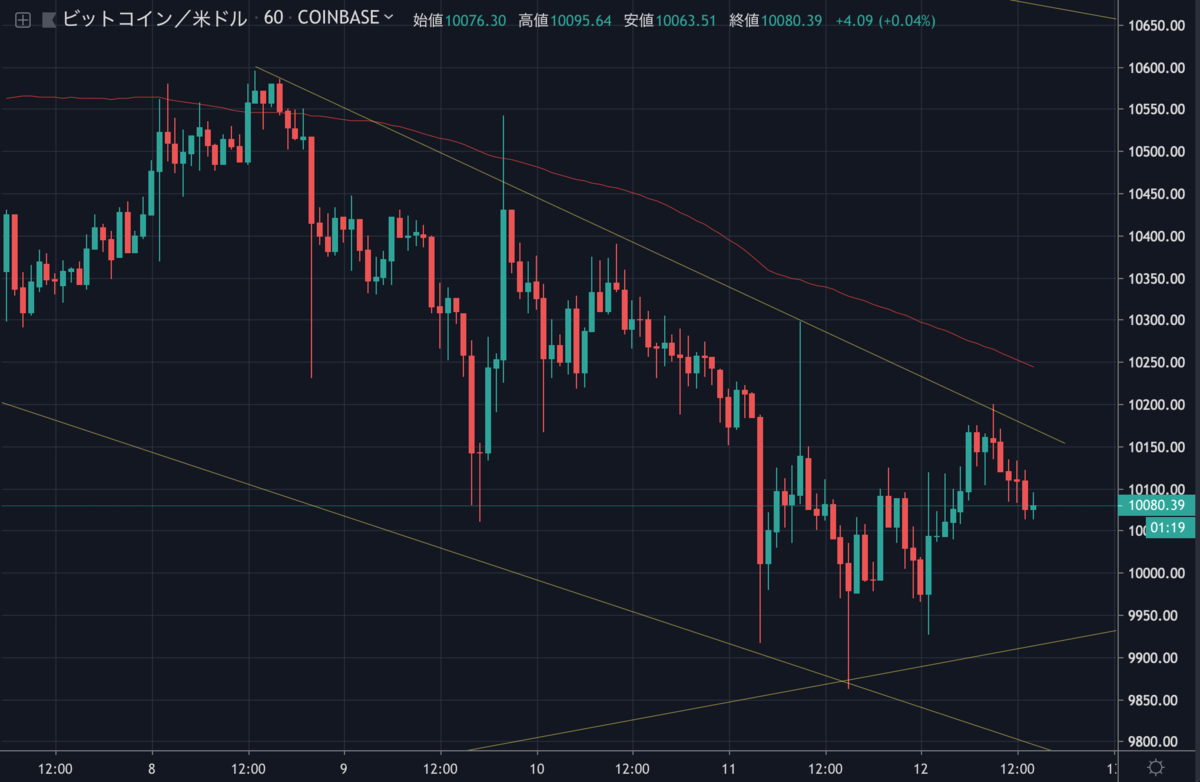
昨日のビットコインは10,000ドルを割り込み一時は9,900ドル以下まで下落、さらに下落が加速するかと思いきや今度は10,200ドル付近まで上昇、現在は10,100ドル付近を推移しています。

Bitcoin Price (BTC) Remains In Steady Corrective Decrease

10,000ドルの攻防が熱いビットコインの今後はどのように予想されるのでしょうか。
NEWS BTCのチャート分析を見てみます。
ビットコインのチャート分析
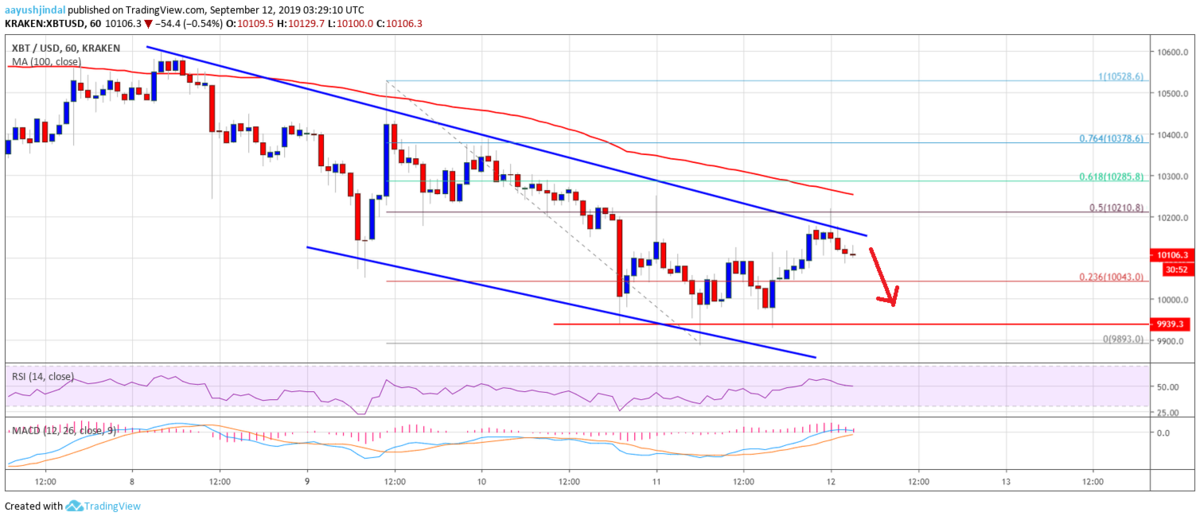
Additionally, there is a major declining channel forming with resistance near $10,180 on the hourly chart of the BTC/USD pair. Above the channel resistance, the 100 hourly SMA is positioned near the $10,250 level. Therefore, the price needs to climb above the $10,200 and $10,250 resistance levels to start a decent recovery.
BTC/USDペアの時間足チャート上には、10,180ドル付近でレジスタンスになる大きな下降チャネルが形成されています。このチャネルレジスタンスの上には、100時間SMA(単純移動平均線)が10,250ドル付近にあります。そのため、本格的に回復を始めるには10,200ドルと10,250ドルを超える必要があります。

If there is no upside break, the price could continue to move down towards $10,000 and $9,900. A downside break below the $9,893 swing low could push the price towards the $9,800 support area. Any further losses could open the doors for a push towards the $9,500 level.
上抜けることができなければ、価格は10,000ドルと9,900ドルに向けて下落を続けるでしょう。安値の9,893ドルを下抜けると、9,800ドルのサポートエリアまで下落する可能性があります。さらに下落すると、9,500ドルを目指す可能性が生じます。
Looking at the chart, bitcoin price is showing bearish signs below the $10,200 and $10,250 levels. Therefore, there are high chances of a bearish break below the $10,000 and $9,800 level in the near term.
チャートを見ると、ビットコインの価格は10,200ドルと10,250ドルレベル以下で弱気のサインを示しています。そのため、近いうちに10,000ドルと9,800ドルを割り込んで下落する可能性が高いでしょう。
via: Bitcoin Price (BTC) Showing Signs of Continued Weakness
_


