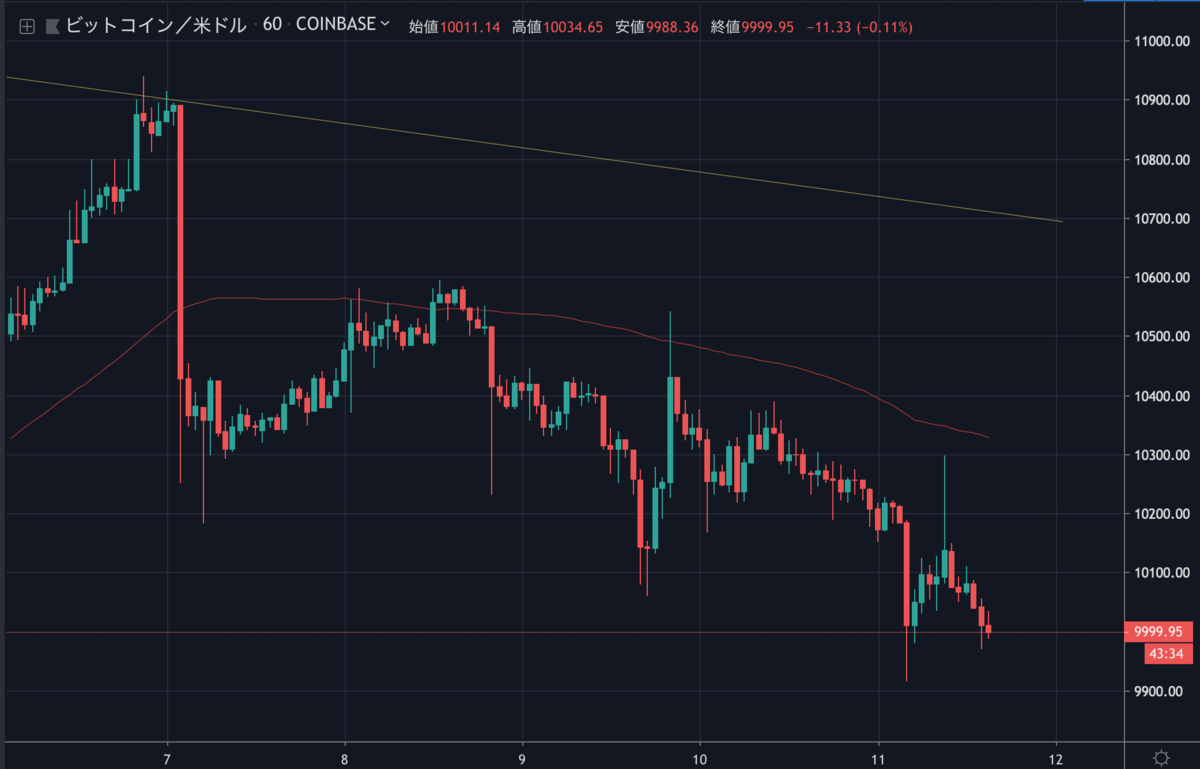
昨日のビットコインは約9,900ドルまで下落、一時は10,000ドル台まで反発したものの、その後も下落を続け、現在は再び10,000ドルを割り込んでいます。

Bitcoin Price (BTC) Is Slowly Turning Sell On Rallies

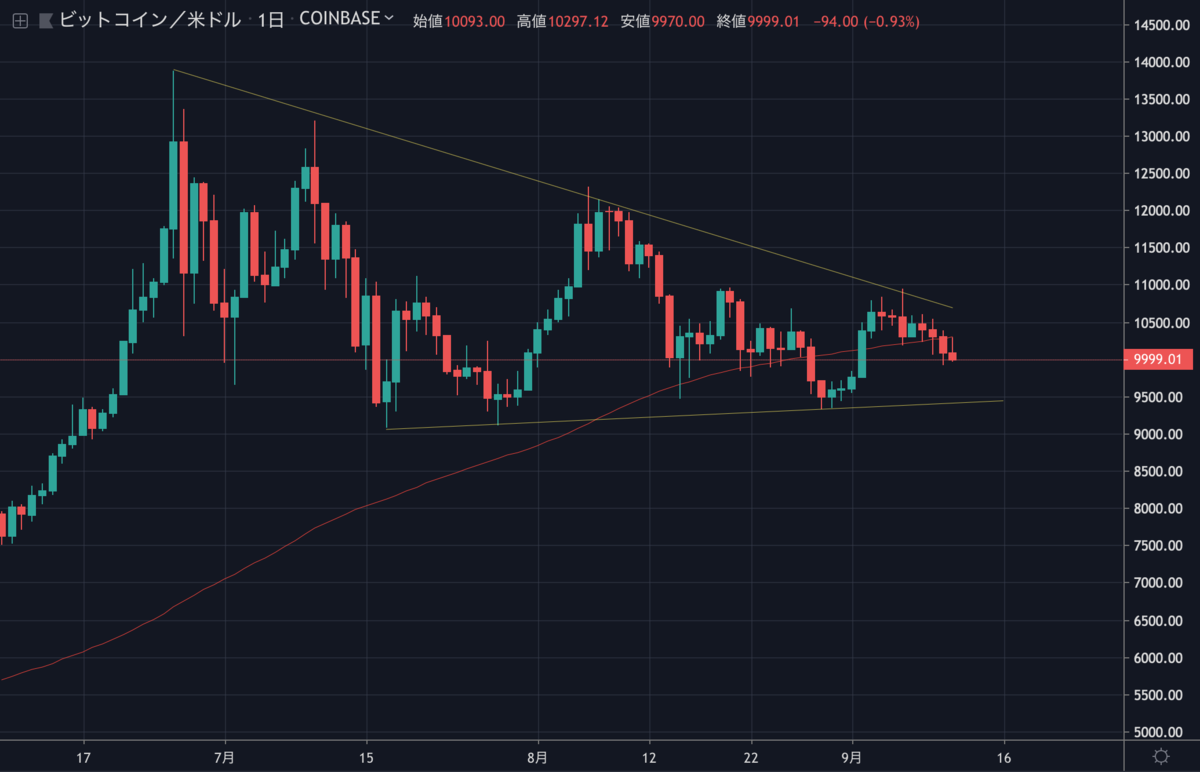
日足チャートでは三角保ち合いを形成し、100SMA(単純移動平均線)を下抜けていることからさらに下落してもおかしくない状況に見えます。

今後の値動きはどのように予想されるのでしょうか。
ビットコインのチャート分析
Recently, there was an upside correction above the $10,000 level.
最近、10,000ドルを超える上方修正がありましたた。
However, the upward move was capped by the $10,200 and $10,250 levels.
しかし、この上昇は10,200ドルと10,250ドルで妨げられました。
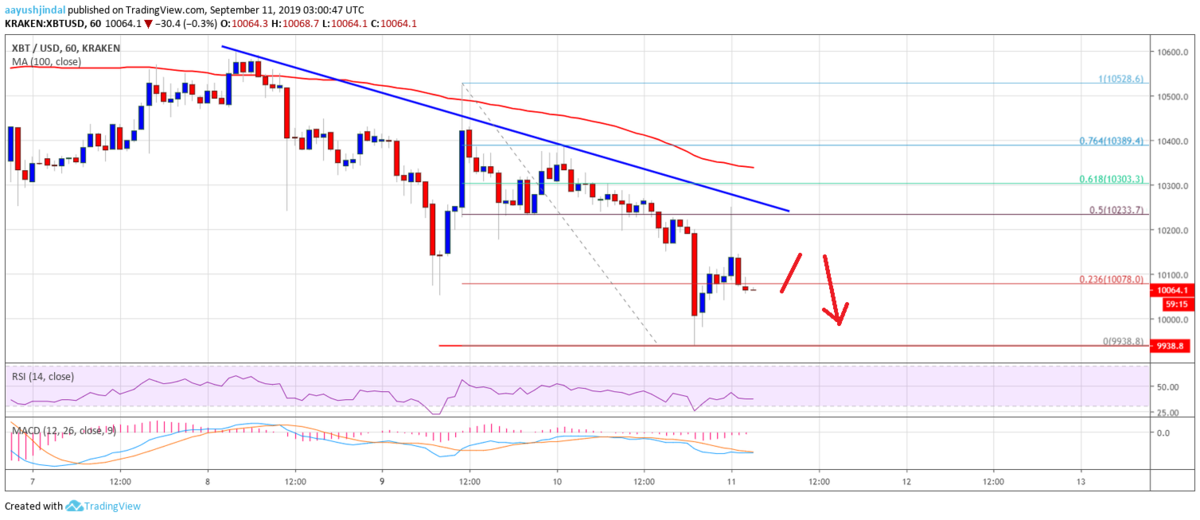
There is also a major bearish trend line forming with resistance near $10,250 on the hourly chart of the BTC/USD pair.
また、BTC/USDペアの時間足チャート上には10,250ドル付近でレジスタンスとなる大きな下降トレンドラインがあります。

Above the trend line, the next key resistance is near the $10,350 level and the 100 hourly SMA.
このトレンドラインの上には、次のレジスタンスが10,350ドルと100時間SMA付近にあります。
On the downside, the $10,000 level is an immediate support. However, the main support is near the $9,950 level. Below $9,950, there are chances of further losses in the near term. The next key support is near the $9,800 level.
下落する場合は10,000ドル付近が直近のサポートになります。しかし、主なサポートは9,950ドル付近です。9,950ドルを下回ると、短期的にさらに下落するでしょう。次の重要なサポートは9,800ドル付近になります。
Looking at the chart, bitcoin price is clearly under pressure and it could continue to slide below $10,000 in the coming sessions. If there is a bearish break below the $9,950 level, the price could head towards the $9,800 level.
チャートを見ると、ビットコインの価格は明らかに圧力にさらされており、今後は10,000ドル以下まで下落を続ける可能性があります。9,950ドルを下抜ければ、9,800ドルに向かう恐れがあります。
via: Bitcoin Price (BTC) Remains In Steady Corrective Decrease
_


