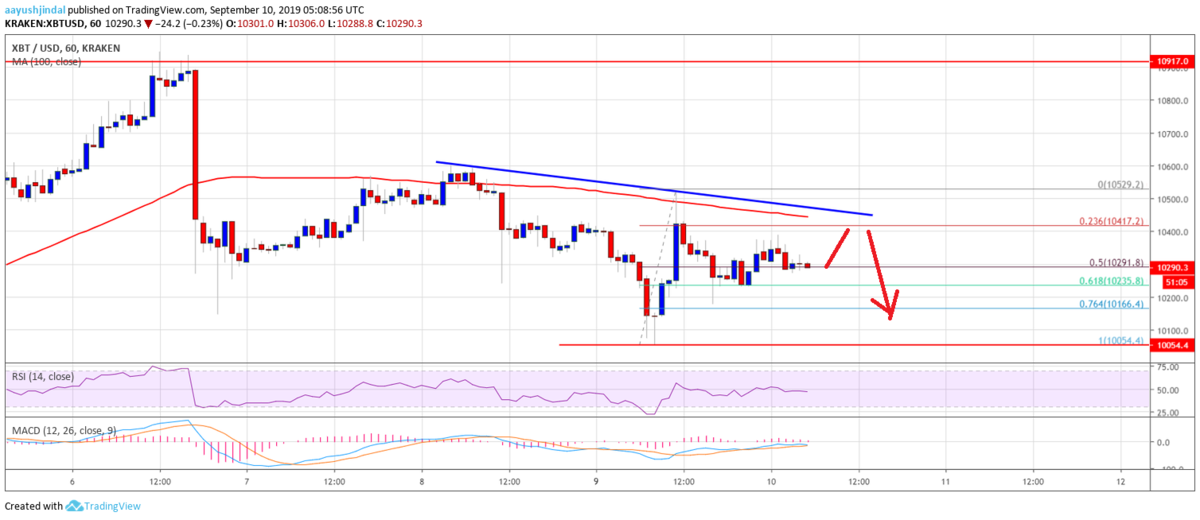
ビットコインは大きな三角保ち合いを形成し、ここ数日はレジスタンスラインに上昇を防がれ下落しています。

昨日は一時10,500ドルを超える急騰があったものの、現在は再びじわじわと価格を下げ、10,250ドル付近で取引されています。
僕のシステムも現在はショート推しなので個人的にはこのまま下落を続けてほしい所ですが、今後の値動きはどのように予想されるのでしょうか。
NEWS BTCのチャート分析を見てみます。
ビットコインのチャート分析
An immediate support is near the $10,250 level and the 61.8% Fib retracement level of the last wave from the $10,054 low to $10,529 high.
直近のサポートは10,250ドルと最後の波(10,054〜10,529ドル)の61.8% Fibリトレースメントレベル付近になります。
If there is a downside break below the $10,250 support, the price could revisit the $10,050 support area. Any further losses could accelerate decline below the $10,050 and $10,000 levels. A clear break below the $10,000 level might call for a drop to $9,500.
10,250ドルのサポートを下抜けた場合は、10,050ドルのサポートまで戻る可能性があります。さらに下落すれば、10,050ドルと10,000を下抜けるまで下落が加速するかもしれません。10,000ドルをはっきりと下抜けた場合、9,500ドルまで下落する可能性があります。

On the upside, an immediate resistance is near the $10,350 and $10,400 levels. Moreover, there is a connecting bearish trend line forming with resistance near $10,450 on the hourly chart of the BTC/USD pair. The 100 hourly SMA is also near the $10,400 level. Therefore, it won’t be easy for the bulls to push the price above the $10,400 and $10,500 resistance levels.
上昇する場合、直近のレジスタンスは10,350ドルと10,400ドル付近になります。さらに、BTC/USDペアの時間足チャートに、10,450ドル付近でレジスタンスとなる下降トレンドラインが形成されています。100時間SMA(単純移動平均線)も10,400ドル付近にあります。そのため、10,400ドルと10,500ドルのレジスタンス突破は容易ではないでしょう。
Looking at the chart, bitcoin price is facing an increase in selling interest below the $10,500 level. As long as the price is trading below the $10,500 level, there are chances of more downsides. If not, the price could surge towards the $11,000 level.
チャートを見ると、ビットコインの価格は、10,500ドルの水準を下回る販売利息の増加に直面している。株価が10,500ドル以下で取引されている限り、さらに下落する可能性がある。そうでなければ、価格は11,000ドルのレベルに急上昇する可能性がある。
via: Bitcoin Price (BTC) Is Slowly Turning Sell On Rallies
_


