
ビットコインは昨日から下落を始め、現在もサポートラインに向けて下落を続けています。
昨日の予想図でもサポートラインまでの下落は想定されていました。問題はここからですね。
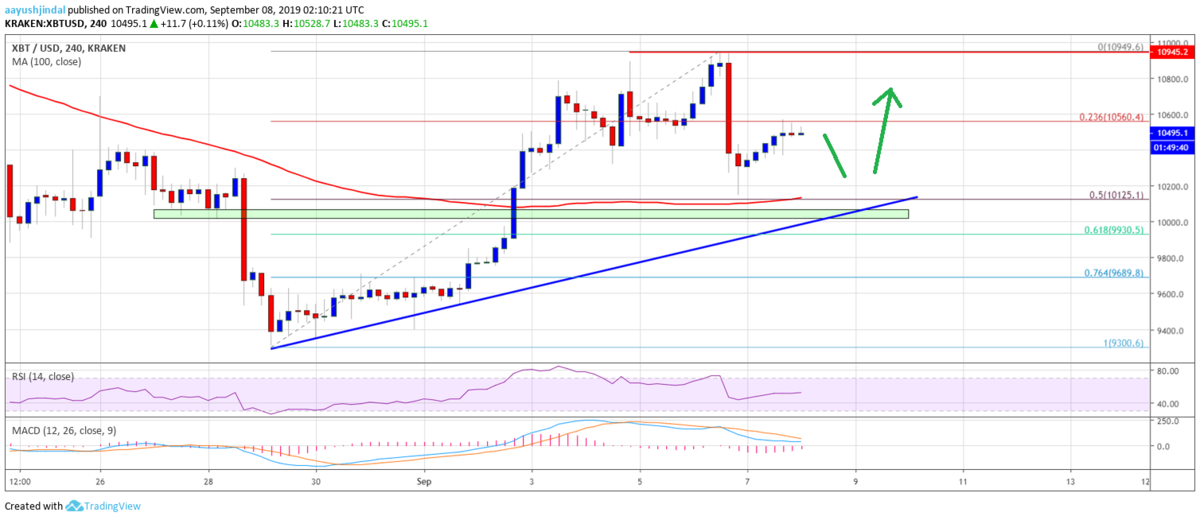
Bitcoin (BTC) Price Weekly Forecast: Downside Thrust Before Fresh Rise?
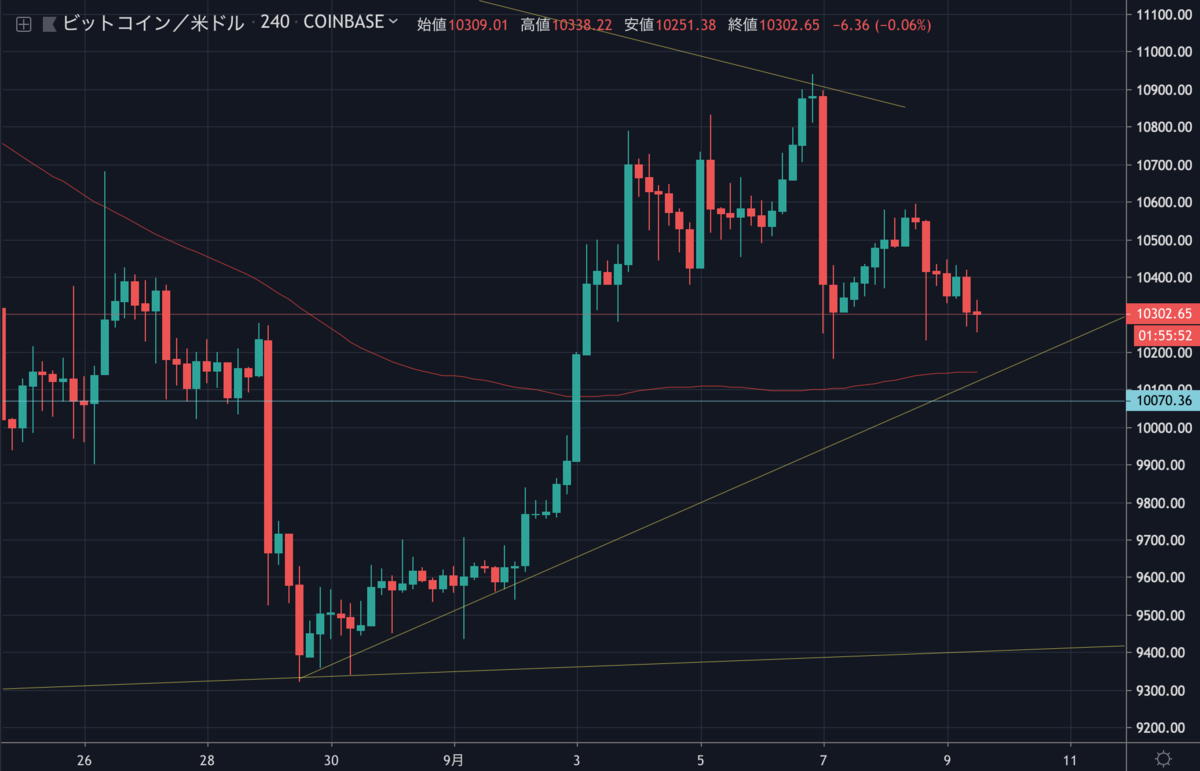
今後のBTCはサポートラインで反発して再び上昇を始めるのでしょうか。
NEWS BTCのチャート分析を見てみます。
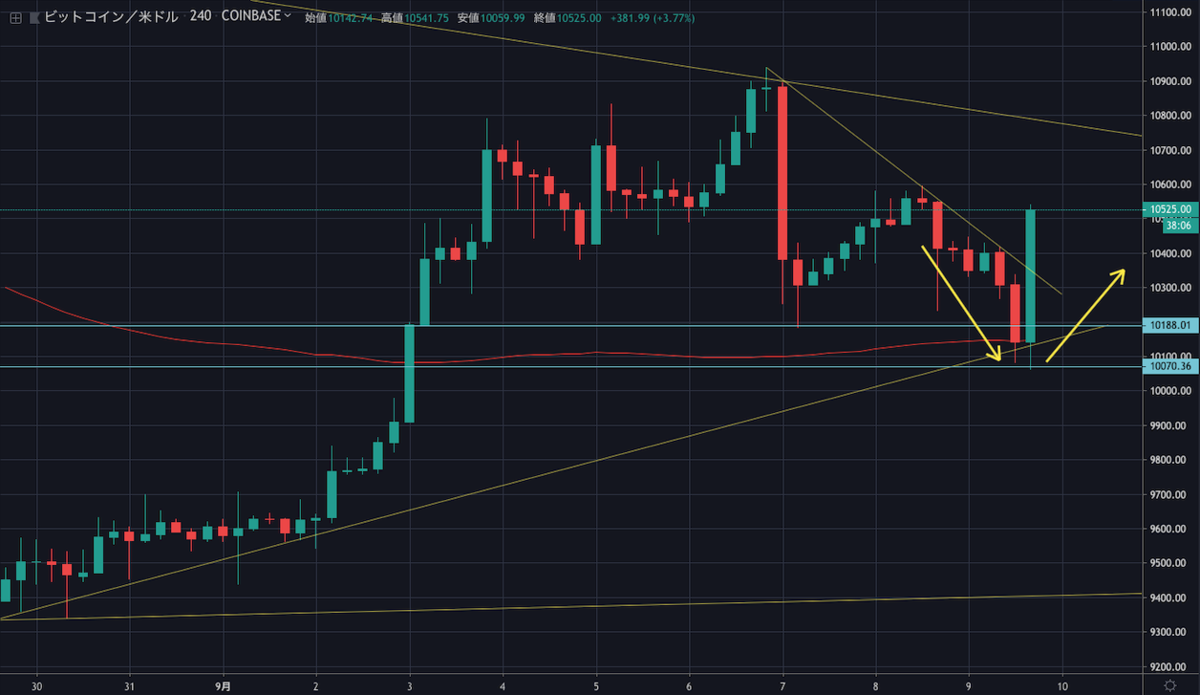
[20:20 追記]
やったか!?
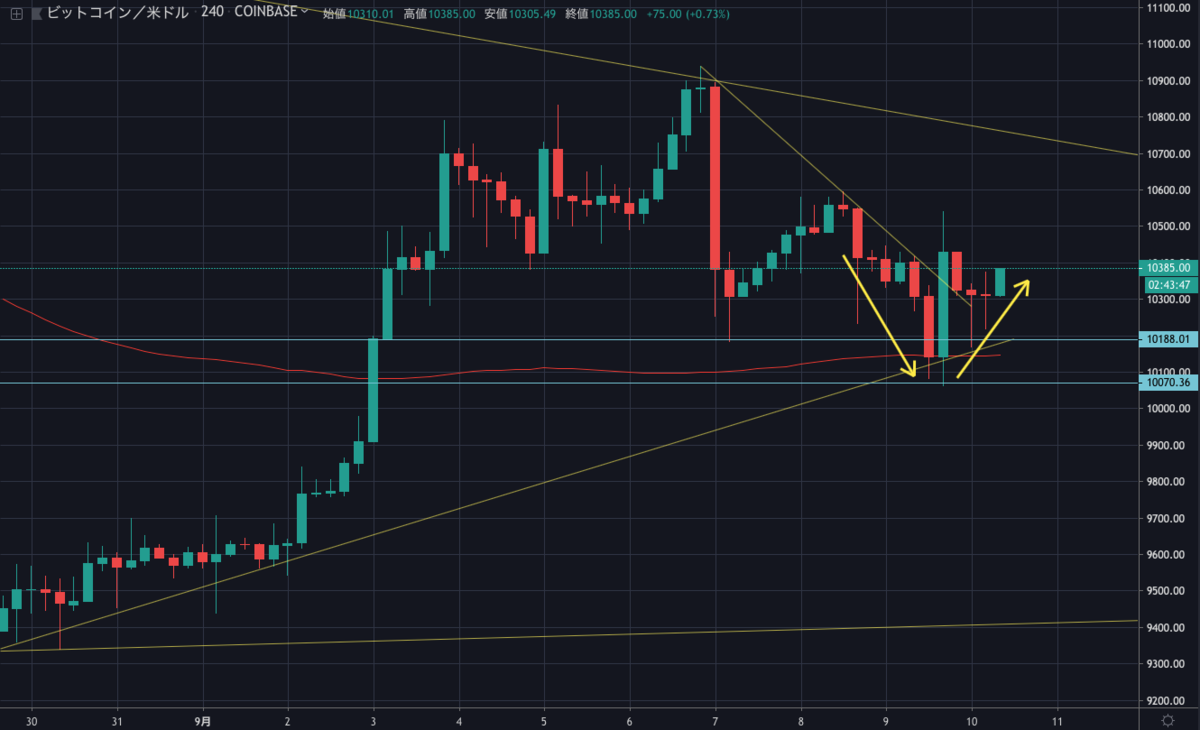
[9/10 10:20 追記]
こうなった。
ビットコインのチャート分析
The pair is currently trading well below the $10,400 level. An immediate support area is near the $10,200 level. If there is a downside break below the $10,200 support area, there could be a bearish acceleration towards the $10,000 support area.
BTC/USDペアは現在10,400ドルレベルを大きく下回って取引されています。直近のサポートエリアは10,200ドル付近、このサポートエリアを下抜けると、10,000ドルのサポートエリアに向けて下落が加速する恐れがあります。
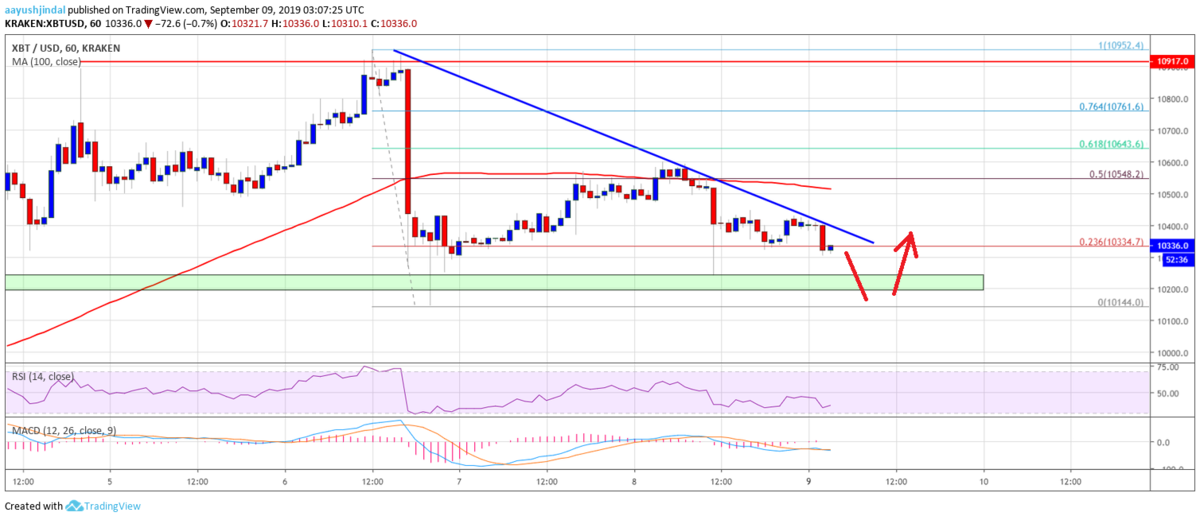
On the upside, the main resistances are near the $10,400 and $10,500 levels. If there is a successful close above $10,500, the price could continue to rise in the coming sessions. The next key resistance is near the $10,650 level. It coincides with the 61.8% Fib retracement level of the last major decline from the $10,952 high to $10,144 low.
上昇時の主なレジスタンスは10,400ドルと10,500ドル付近。10,500ドル以上で引けることができれば、価格は今後上昇を継続する可能性があります。次の重要なレジスタンスは10,650ドル付近になります。これは最近の大きな下落(10,952〜10,144ドル)の61.8% Fibリトレースメントレベルと一致します。
Looking at the chart, bitcoin price is clearly struggling to continue higher and is trading with a bearish angle below the $10,400 level. If the price continues to decline and breaks the $10,200 support area, there is a risk of more losses below the $10,000 level.
チャートを見ると、ビットコインの価格は明らかに上昇継続に苦戦しており、10,400ドルレベルを下回り右肩下がりで推移しています。価格の下落が継続し、10,200ドルのサポートを割り込めば、さらに下落して10,000ドルを下抜ける恐れもあります。
via: Bitcoin Price (BTC) At Risk Of Downside Break Below $10,200
_


