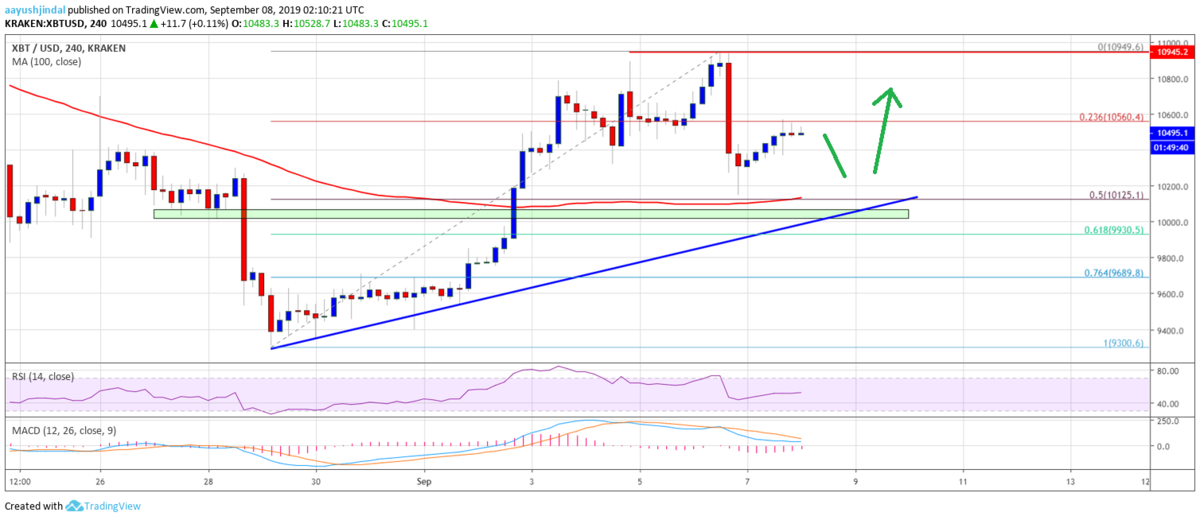
ビットコインは昨日、10,900ドルから10,200ドルまで約700ドル下落しました。現在は10,500ドル付近で取引されています。

上の画像のように、昨日のBTCは予想以上に大きく下落しましたが、その後は再びゆるやかに上昇しています。
今後の値動きはどのように予想されるのでしょうか。NEWS BTCのチャート分析(週間予想)を見てみます。
ビットコインのチャート分析
A swing high was formed near $10,949 before the price started a downside correction. There was a sharp decline below the $10,800 and $10,500 support levels.
10,949ドル付近で高値を付けた後、価格は下方修正を始め、10,800ドルと10,500ドルのサポートを下抜けて急落しました。

Finally, there was a break below the $10,400 level. However, the price stayed above the $10,000 support and the 100 SMA.
最終的に、10,400ドルを下抜けたものの、10,000ドルのサポートと100SMA(単純移動平均線)以上に留まりました。
There is also a key bullish trend line forming with support near $10,200 on the 4-hours chart of the BTC/USD pair. If there is a downside break below the trend line support, there could be a sharp decline below $10,000 in the near term.
また、BTC/USDペアの4時間足チャートには、10,200ドル付近でサポートとなる重要な上昇トレンドラインがあります。トレンドラインのサポートを下抜けると、近いうちに10,000ドルを大きく下回る可能性があります。
On the upside, an initial resistance is near the $10,600 level. If there is an upside break above $10,600, the price could revisit the $10,800 resistance. Finally, a close above the $11,000 level may perhaps set the pace for a larger upward move towards the $11,700 level.
上昇する場合の最初のレジスタンスは10,600ドル付近になります。10,600ドルを上抜けると、価格は再び10,800ドルのレジスタンスに届くでしょう。最終的に、11,000ドル以上で引ければ、11,700ドル付近に向けてさらに大きな上昇を始める可能性があります。
Overall, there could be another dip towards $10,100 before a fresh increase.
全体として、新たな上昇の前に10,100ドルに向けてさらに下落する可能性があります。
via: Bitcoin (BTC) Price Weekly Forecast: Downside Thrust Before Fresh Rise?
_


