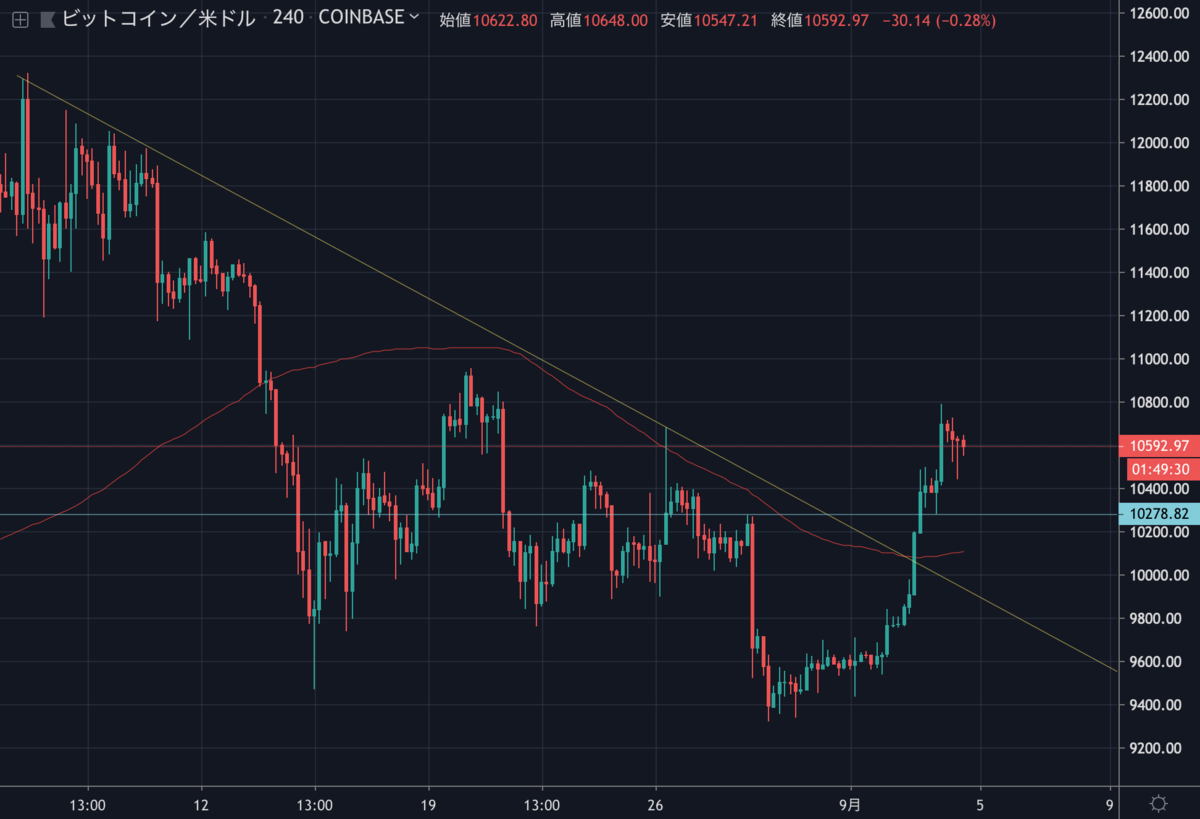
先週急落したビットコインは、昨日の急騰で再び10,000ドルを突破しました。その後さらに複数の抵抗線を上抜け、現在は10,600ドル付近まで値を戻しています。

NEWS BTCは先週の下落予想を外したものの、昨日の上昇予想は的中し、BTCのチャートは予想図通りの展開になりました。
今日もNEWS BTCのチャート分析を見てみます。
ビットコインのチャート分析
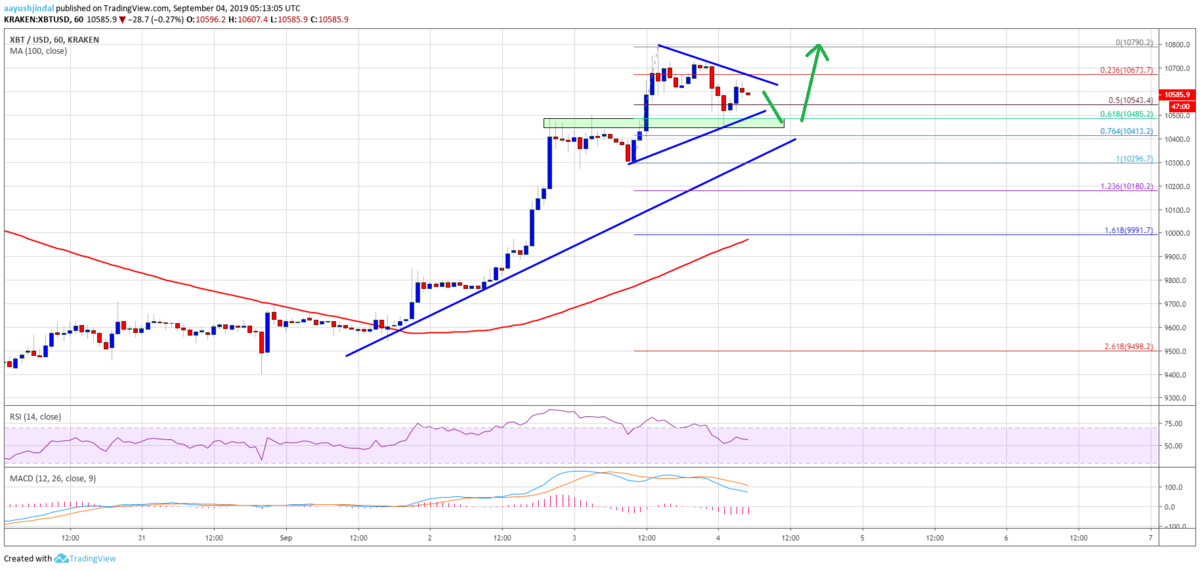
Yesterday, we saw a nice upward move in BTC, Ethereum and ripple against the US Dollar. The bulls gained traction and pushed bitcoin above the $10,400 and $10,500 resistance levels.
昨日、BTCやイーサリアム、リップルなどで好調な上昇が見られました。強気派は勢いを増し、ビットコインの価格を10,400ドルおよび10,500ドルのレジスタンスレベル以上に押し上げました。
At the moment, there is a contracting triangle forming with support near $10,450 on the same chart. In the short term, the price could decline towards the $10,450 and $10,400 support levels. As long as the price is above $10,400, there could be another rise towards the $10,800 resistance level.
現在は、同チャート上に10,450ドル付近でサポートとなる三角保ち合いが形成されており、短期的には10,450ドルと10,400ドルのサポートに向けて下落する可能性があります。価格が10,400ドル以上である限りは、10,800ドルのレジスタンスに向けてさらに上昇する可能性があります。

Conversely, if the price fails to stay above the $10,400 support, it could extend its correction. The next key support is near the $10,200 level, plus the 1.236 Fib extension level of the upward move from the $10,296 low to $10,790 high. The main support is near the $10,000 level, which is also close to the 100 hourly simple moving average.
逆に、10,400ドルのサポート以上で維持できない場合は下落を拡大する可能性があります。次の重要なサポートは10,200ドル付近、さらに上昇の動き(10,296ドル〜10,790ドル)の1.236 フィボナッチ・エクステンション付近もサポートになります。主なサポートは10,000ドル付近、これは100時間SMA(単純移動平均線)付近でもあります。
via: Bitcoin Price (BTC) Surging, Dips Remains Well Supported
_


