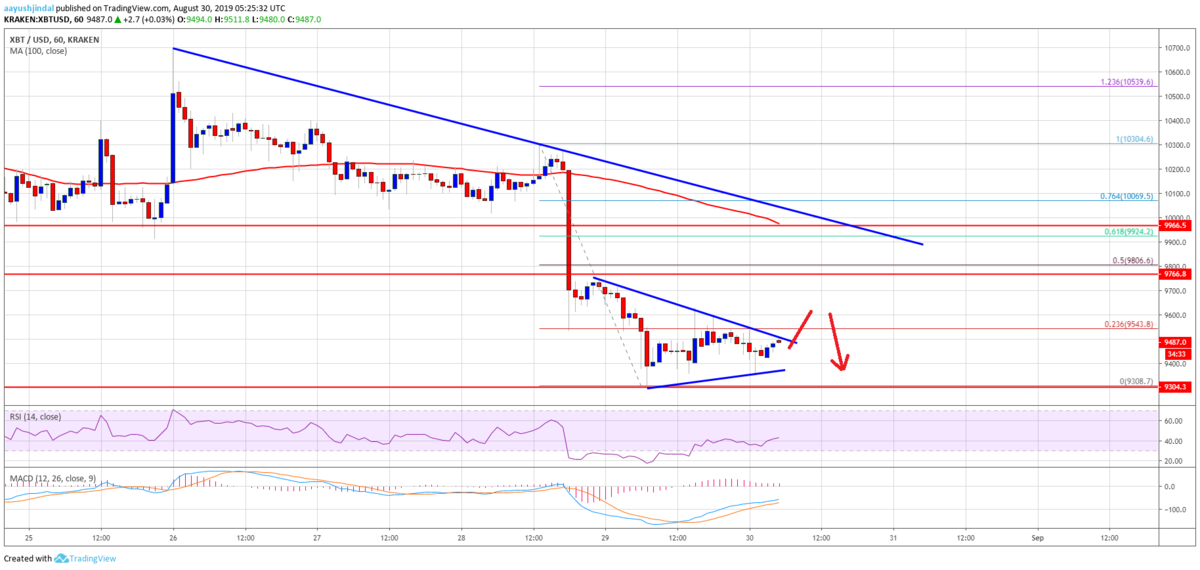
昨日未明に急落したビットコインは、その後大きく反発することもなく、現在は9,500ドル付近で推移しています。
日足では100SMA(単純移動平均線)を下抜け、週足ではMACDが弱気シグナルを出しており、今後のさらなる下落が予想されます。
海外の記事を見ると「今が買いのチャンス」という意見もありますが、短期的な値動きはどのように予想されるのでしょうか。NEWS BTCのチャート分析を見てみます。
ビットコインのチャート分析
An immediate resistance is near the $9,500 level.
直近のレジスタンスは9,500ドル付近になります。
More importantly, there is a short term breakout pattern forming with resistance near $9,500 on the hourly chart of the BTC/USD pair. Therefore, if there is an upside break above $9,500, the price could extend its upside correction.
さらに重要なのは、BTC/USDペアの時間足チャートに、9,500ドル付近でレジスタンスになる短期的なブレイクアウトパターンが形成されていることです。そのため、もし9,500ドルを上抜けた場合は、さらに価格が上昇する可能性があります。

The next key resistance is near the $9,760 level (the previous support). However, the main resistance is near the $9,800 level.
次の重要なレジスタンスは9,760ドル付近(以前のサポート)になりますが、主なレジスタンスは9,800ドル付近です。
On the downside, an initial support is near the $9,400 level. If there is a downside break below the $9,400 and $9,300 levels, the price could extend its decline. The next target for the bears could be near the $9,000 level.
下落する場合の直近のサポートは9,400ドル付近。9,400ドルと9,300ドルを下抜けると、さらに大きく下落する可能性があります。売り方の次のターゲットは、9,000ドル付近になるでしょう。
via: Bitcoin Price (BTC) In Higher Degree Downtrend Below $10K
_


