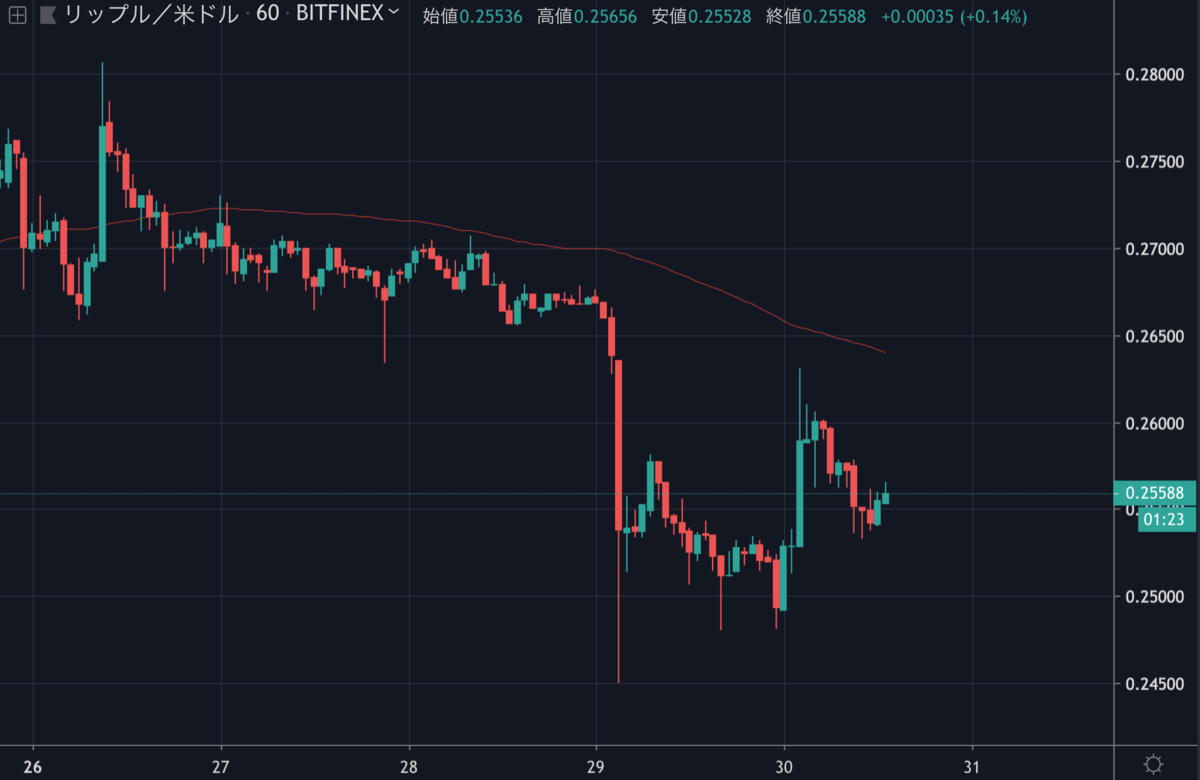
昨日は、ビットコインの急落に連動してリップル(XRP)も急落しました。
今日の午前0時頃に反発して約5%上昇したものの、その勢いが続くことなく、現在は再び下落しています。

テクニカル的には弱気のシグナルが出ているようです。
NEWS BTCでXRPのチャート分析を見てみます。
リップル(XRP)のチャート分析
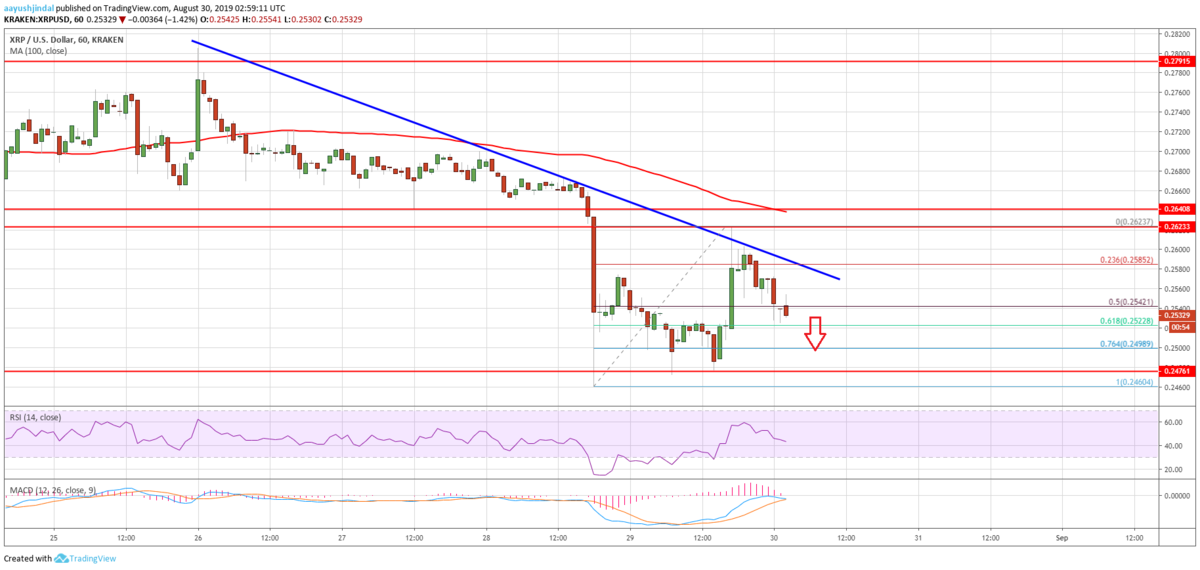
An immediate support on the downside is near the $0.2520 level.
下落する場合の直近のサポートは0.252ドル付近になります。
Therefore, a downside break below the $0.2520 support may accelerate decline. The next stop for the bears could be near the last swing low at $0.2460. More importantly, the price may perhaps continue to move down towards the $0.2420 and $0.2400 supports.
そのため、0.252ドルのサポートを下抜けると下落が加速する可能性があります。売り方が次に目指すのは、前回の安値0.246ドル付近になるでしょう。さらに重要なのは、0.242ドルと0.24ドルのサポートに向かって下落が続く可能性があることです。

On the upside, there is a major resistance forming near the $0.2580 and $0.2600 levels. Besides, yesterday’s highlighted major bearish trend line is active with resistance near $0.2580 on the hourly chart of the XRP/USD pair. Therefore, it won’t be easy for the bulls to push the price above the $0.2580 and $0.2600 resistances.
上昇する場合は、0.258ドルと0.26ドル付近に大きなレジスタンスが形成されています。さらに、昨日注目した強い下降トレンドラインも機能しており、XRP/USDペアの時間足チャートの0.258ドル付近でレジスタンスになります。そのため、0.258ドルと0.26ドルのレジスタンスを超えて上昇するのは容易ではないでしょう。
Looking at the chart, ripple price is clearly struggling to continue higher above $0.2580 and $0.2600. On the downside, a clear break below $0.2520 and $0.2500 is likely to push the price further lower. The bears are likely to target the $0.2420 and $0.2400 support levels in the near term.
チャートを見ると、リップルの価格は明らかに0.258ドルと0.26ドル以上の上昇を続けられずに苦戦しています。下落する場合、0.252ドルと0.25ドルをはっきりと下抜けると、価格がさらに下がる可能性が高くなります。弱気派は短期的に0.242ドルと0.24ドルのサポート付近を目指すでしょう。
via: Ripple Price (XRP) Showing Signs of Further Weakness
_


