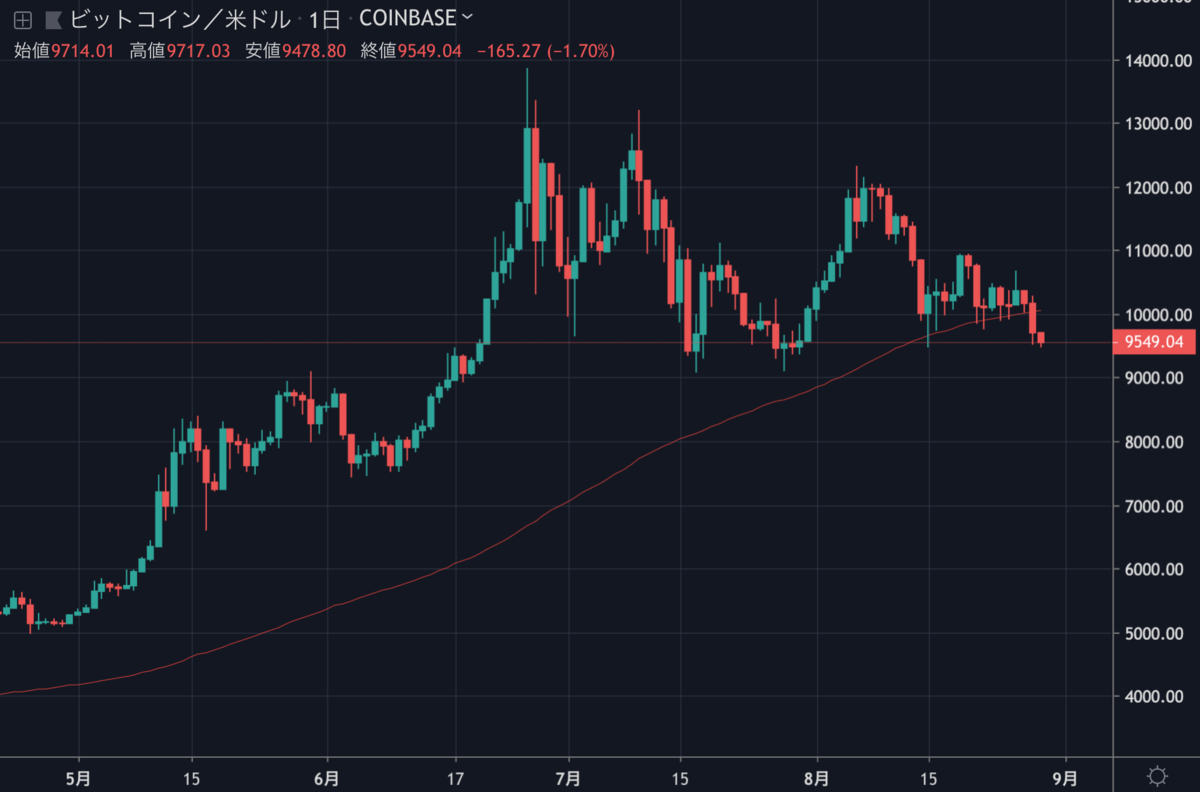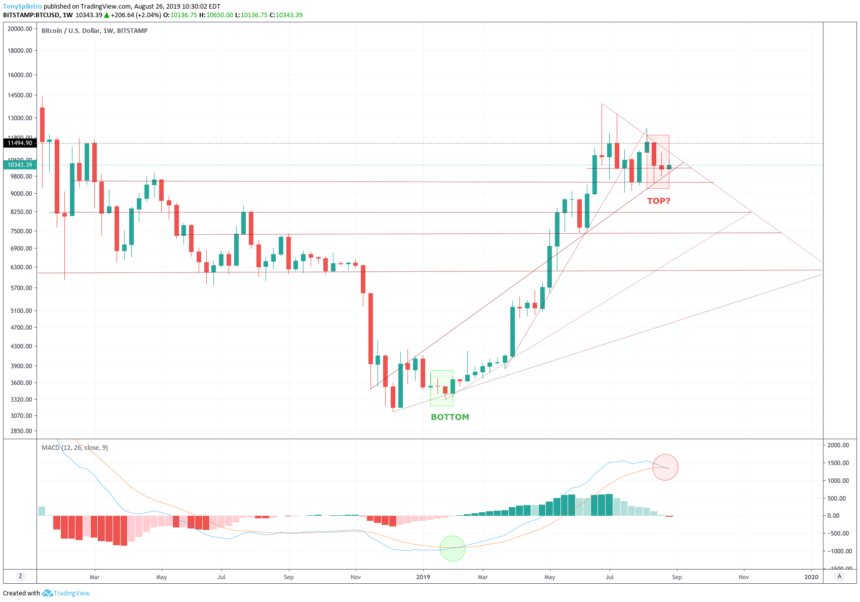
昨日までもみ合っていたビットコインは、今日午前3時頃に急落し、しばらく維持していた1万ドルを割り込みました。記事執筆時点では、9,500ドル付近で取引されています。
日足チャートを見ても100SMA(単純移動平均線)を明確に下抜けています。

また、週足チャートではMACDが弱気に転じています。

もはや見るまでもない気がしますが、念のためNEWS BTCのチャート分析を見てみます。
ビットコインのチャート分析
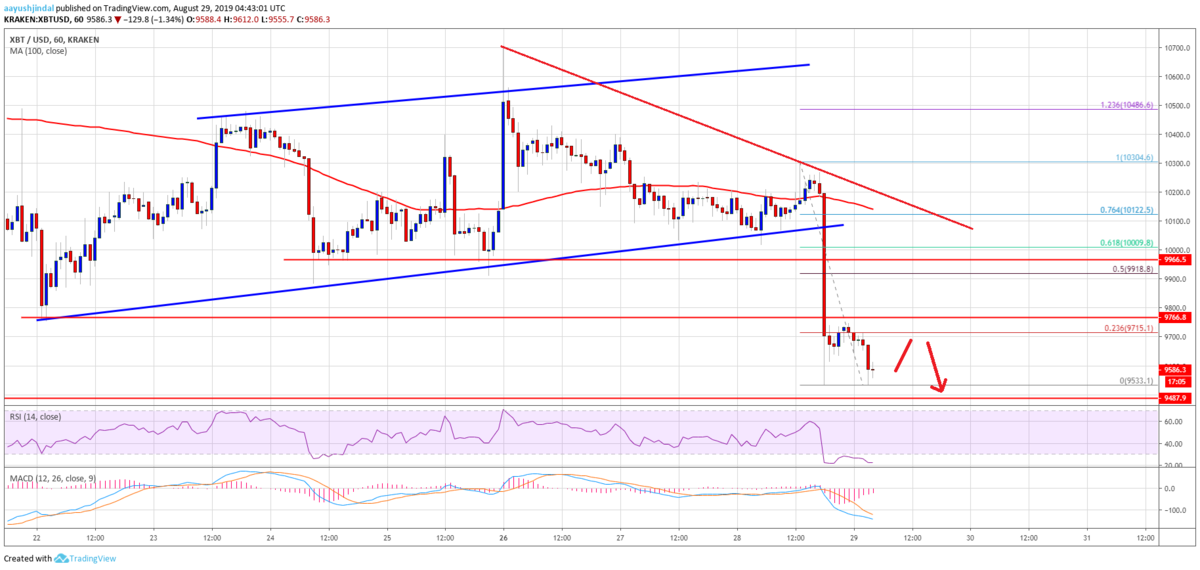
The price is currently struggling to recover above the $9,650 and $9,700. Above these, the next key resistance is near the $10,000 level.
価格は現在、9,650ドルと9,700ドルを超える回復ができずにいます。これらを上抜けた場合、次の重要なレジスタンスは10,000ドル付近になります。

Therefore, an upside correction towards the $9,800 and $10,000 levels could face a strong selling interest in the near term. On the downside, an immediate support is near the $9,500 level. If there is a downside break below the $9,500 support, the price could continue to decline towards the $9,200 support area.
そのため、9,800ドルと10,000ドルに向けた上昇は、短期的に強い売りに直面する可能性があります。下落する場合の直近のサポートは9,500ドル付近。もし9,500ドルのサポートを下抜けると、9,200ドルのサポートエリアに向けて下落を続けるでしょう。
Looking at the chart, bitcoin price is clearly trading in a downtrend below $9,800 and $10,000. Any upside recovery is likely to face sellers near $9,800 and $9,850. On the downside, the bears are likely to aim for a break below $9,500.
チャートを見ると、ビットコインの価格は明らかに9,800ドルと10,000ドルを下回る下降トレンドで取引されています。上昇に転じたとしても9,800ドルと9,850ドル付近で売りが入る可能性があります。下落する場合、売り方に9,500ドルのブレイクが狙われる可能性が高いでしょう。
via: Bitcoin Price (BTC) Trend Overwhelmingly Bearish, Turned Sell On Rallies
_


