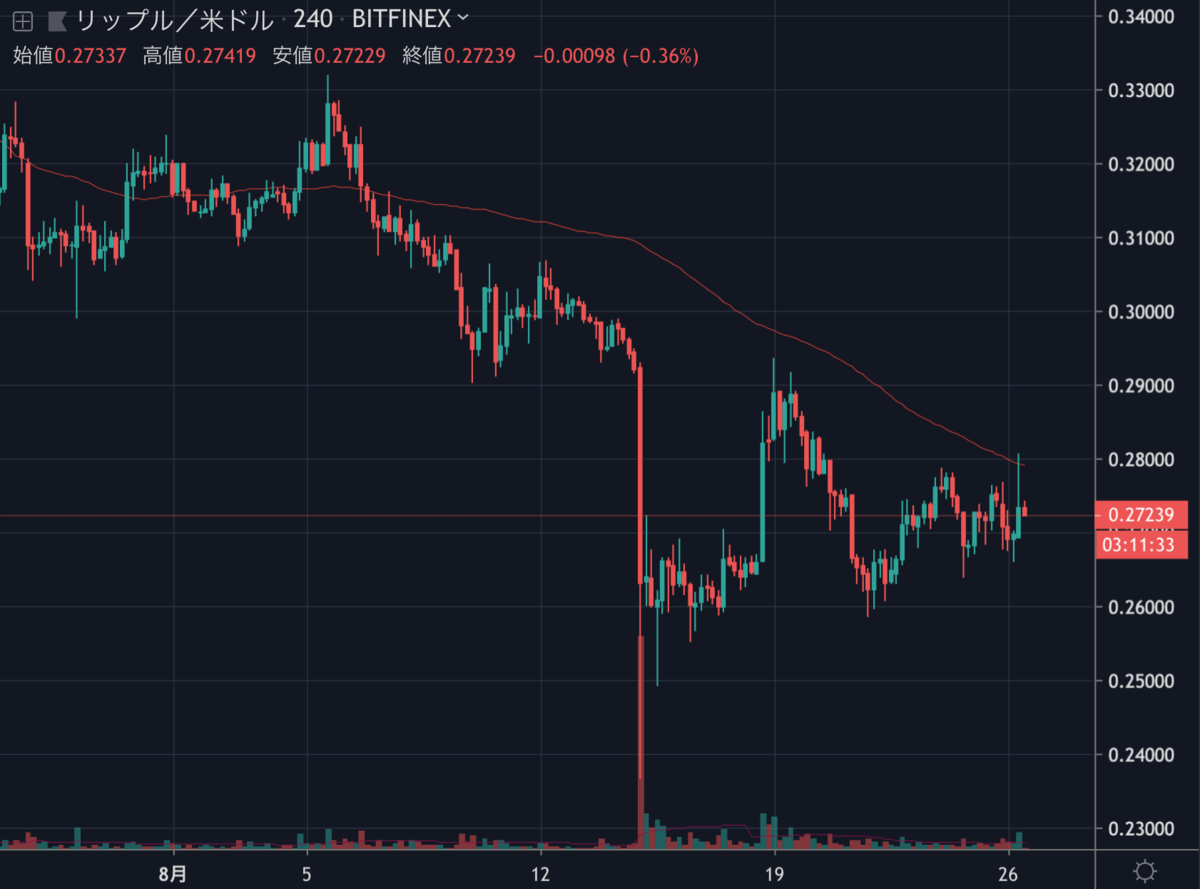
先日強烈な下落を見せたリップル(XRP)は、その後下げ止まりレンジ相場を形成しています。

さすがにここまで来ると、もう売り手がいないのでしょうか?
NEWS BTCでXRPのチャート分析を見てみます。
リップル(XRP)のチャート分析
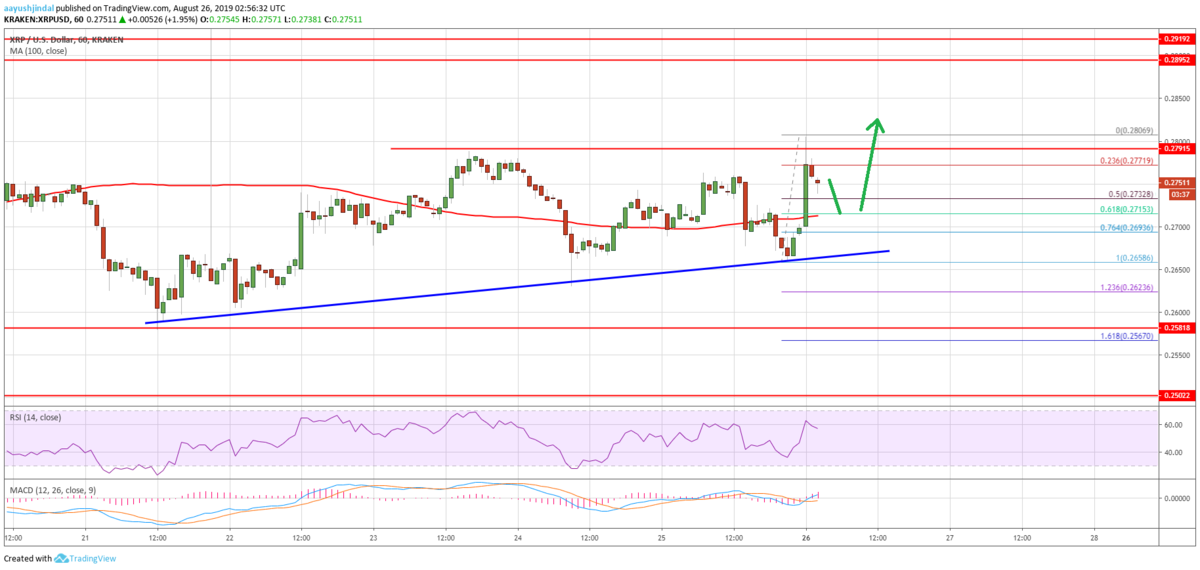
On the downside, there are a few key supports near the $0.2740 and $0.2720 levels. The main support is near the $0.2715 and the 100 hourly simple moving average.
下落する場合は、0.274ドルと0.272ドル付近に重要なサポートがいくつかあります。主なサポートは0.2715ドルと100時間SMA(単純移動平均線)付近になります。

Moreover, there is a key major bullish trend line with support near $0.2680 on the hourly chart of the XRP/USD pair. An immediate support is near the $0.2730 level. It represents the 50% Fib retracement level of the recent wave from the $0.2658 low to $0.2806 high.
さらに、XRP/USDペアの時間足チャートには、0.268ドル付近でサポートになる重要な上昇トレンドラインがあります。直近のサポートは0.273ドル付近。これは、最近の波(0.2658ドル〜0.2806ドル)の50% Fibリトレースメントレベルになります
On the upside, an initial resistance is near the $0.2780 and $0.2800 levels. A successful close above the $0.2800 resistance could open the doors for a decent ride. The main resistances are near the $0.2900 ad $0.2920 levels (the ones acted as a strong barrier this past week). Conversely, if the price fails to stay above the $0.2700 support and the trend line, it could continue to decline in the coming sessions.
上昇する場合は、最初のレジスタンスは0.278ドルと0.28ドル付近になります。0.28ドルのレジスタンス以上で引ければ、かなりの上昇が見込めるかもしれません。主なレジスタンスは、0.29ドルと0.292ドル付近(この1週間の強力なバリア)になります。逆に、0.27ドルのサポートとトレンドライン以上に留まることができなければ、今後も下落を継続するでしょう。
Looking at the chart, ripple price is showing a few positive signs above the $0.2700 support and pivot area. However, the price must gain momentum above the $0.2800 resistance to revisit the main $0.2900 resistance in the near term.
チャートを見ると、リップルの価格は0.27ドルのサポートとピボットエリア以上でいくつかのポジティブサインを見せています。しかし、主なレジスタンスである0.29ドルに再び到達するには、0.28ドルのレジスタンスを突破する勢いが必要です。
via: Ripple Price (XRP) Hesitates But Further Recovery Seems Likely
_


