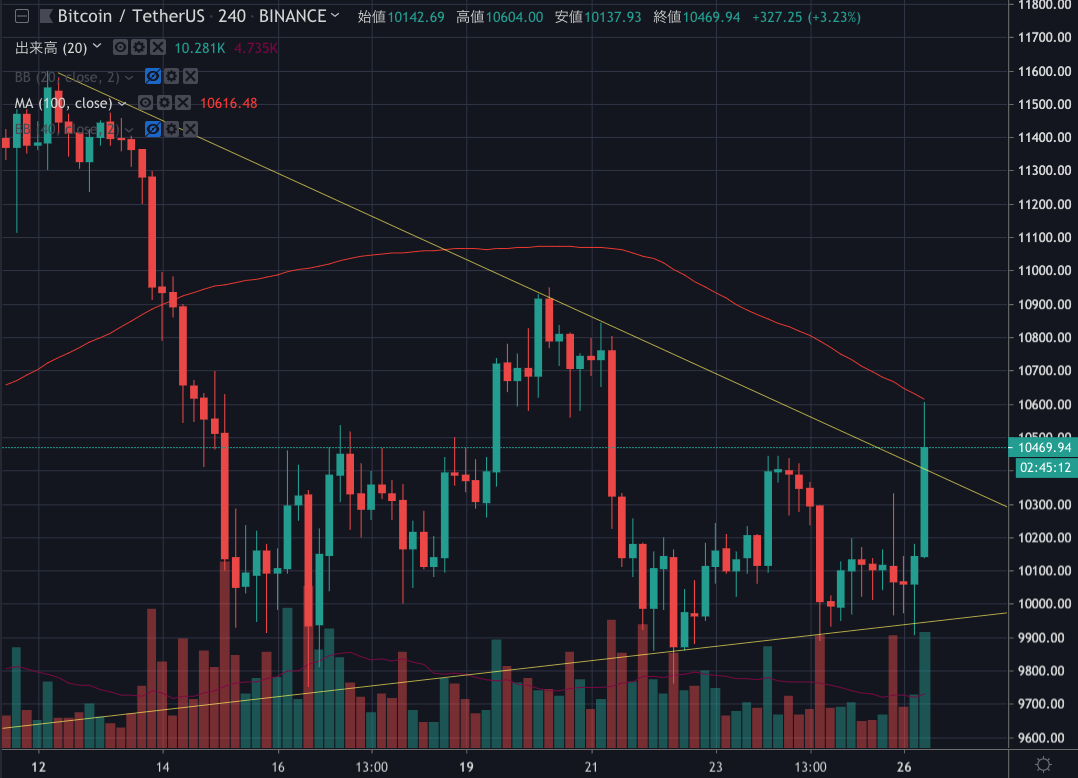
昨日のビットコインは10,300ドル付近から急落し、約9,900ドルの安値を付けました。その後少し回復して、現在は10,000ドル付近を推移しています。

いよいよどちらかにブレイクしそうな雰囲気です。NEWS BTCのチャート分析(週間予想)を見てみます。
[8/26 10:00 追記]
ドーン!

きっちり100SMAに跳ね返されとる。
ビットコインのチャート分析
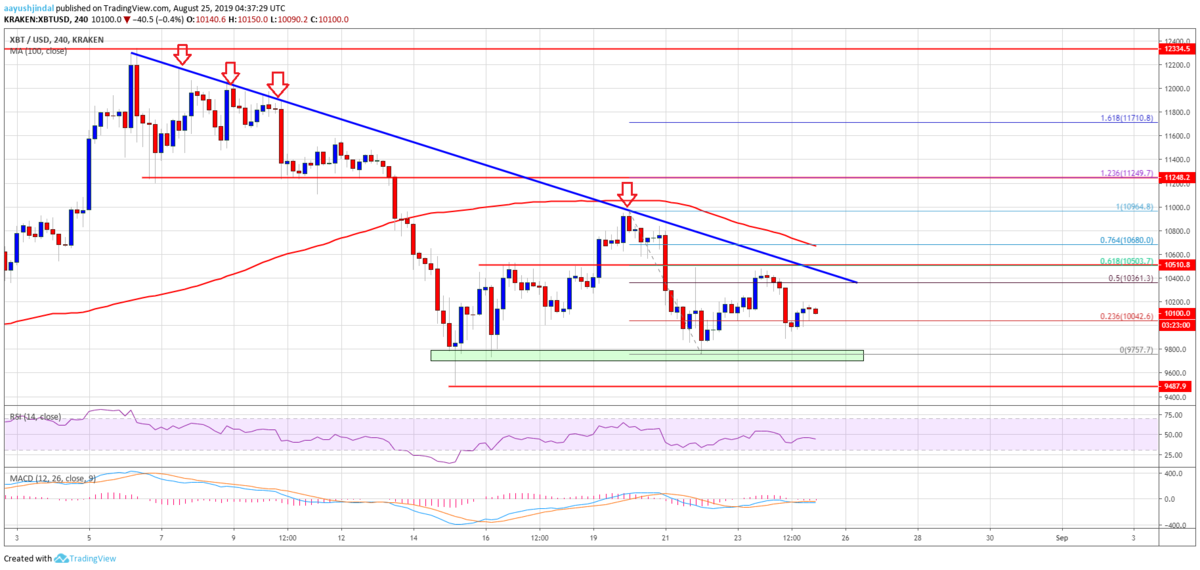
Clearly, there is a strong resistance forming near $10,400 and $10,500. More importantly, there is a crucial bearish trend line forming with resistance near $10,400 on the 4-hours chart of the BTC/USD pair. Above the trend line, the next key resistance is near the $10,680 level and the 100 simple moving average (4-hours). It also coincides with the 76.4% Fib retracement level of the recent drop from the $10,964 high to $9,757 low.
10,400ドルと10,500ドル付近で明らかに強いレジスタンスが形成されています。さらに重要なのは、BTC/USDペアの4時間足チャートで、10,400ドル付近でレジスタンスになる強い下降トレンドラインが形成されていることです。このトレンドラインの上には、次の重要なレジスタンスが10,680ドルと100期間移動平均線(4時間足)付近にあります。これは、最近の下落(10,964ドル〜9,757ドル)の76.4% Fibリトレースメントレベルと一致します。

Therefore, an upside break above $10,500 and $10,680 could spark a strong upward move in bitcoin. The next stop for the bulls could be near the $10,900 and $11,000 levels. Conversely, if the price struggles to gain traction above $10,400 and $10,500, there could be a fresh decline. An immediate support is near the $10,000 level. However, the main support is near the $9,800 area, below which the price could tumble.
そのため、10,500ドルと10,680ドルを上抜けることができれば、ビットコインが強く上昇する可能性があります。強気派が次に目指すのは、10,900ドルと11,000ドル付近になるでしょう。逆に、10,400ドルと10,500ドルを超える勢いがなければ再び下落するでしょう。直近のサポートは10,000ドル付近になります。しかし、主なサポートは9,800ドル付近、これを下回ると下落する可能性があります。
Looking at the chart, bitcoin price is facing an uphill task near $10,400 and $10,500. Until there is a close above $10,500, the bears remain in action
チャートを見ると、ビットコインの価格は10,400ドルと10,500ドル付近のレジスタンスに直面しています。10,500ドル以上で引けない限り、強気に転じることはないでしょう。
via: Bitcoin (BTC) Price Weekly Forecast: Remains Sell Until This Changes
_


