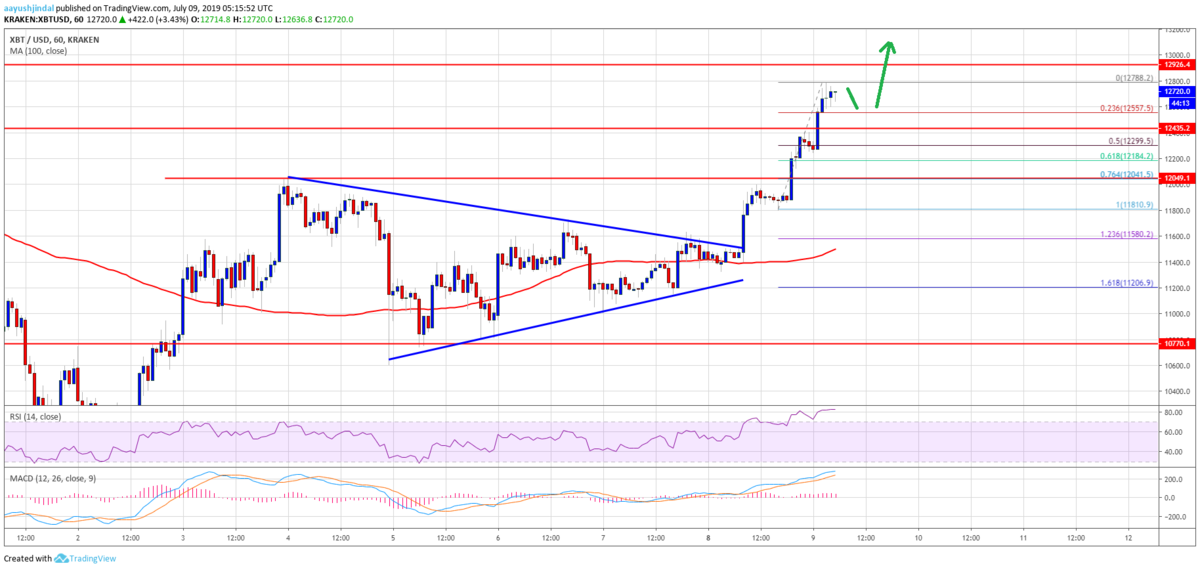
三角保ち合いを上抜けしたビットコインはその後も上昇を続け、記事執筆時点では1万2700ドル付近で取引されています。先月記録した高値1万3800ドルまで強いレジスタンス(抵抗線)はなさそうに見えますが、今後はどのような値動きを見せるのでしょうか?
NEWS BTCのチャート分析を見てみます。
ビットコインのチャート分析
An initial support is near the $12,600 level plus the 23.6% Fib retracement level of the recent rally from the $11,810 low to $12,788 high. On the downside, there are many important supports near the $12,500 level. If there are more losses, the $12,250 level may act as a strong support. It coincides with the 50% Fib retracement level of the recent rally from the $11,810 low to $12,788 high.
最初のサポートは12,600ドル付近と、最近の上昇(11,810ドル〜12,788ドル)の23.6%フィボナッチリトレースメント付近になります。下には12,500ドル付近に多くの重要なサポートがあります。さらに下落した場合は、12,250ドル付近が強力なサポートとして機能するでしょう。これは最近の上昇(11,810ドル〜12,788ドル)の50%フィボナッチリトレースメントと一致します。
On the upside, an initial resistance is near the $12,800 level. If there is an upside break, the price is likely to climb further above the $13,000 level. The next major resistance for the bulls is near the $13,200 level.
上側には12,800ドル付近に最初のレジスタンスがあります。これを上抜ければ、価格は13,000ドルを超えて上昇する可能性が高いでしょう。次の主要なレジスタンスは13,200ドル付近になります。

Looking at the chart, bitcoin price is clearly trading with a strong bullish bias above the $12,200 and $12,500 support levels. Therefore, there are high chances of more upsides above the $13,000 level in the coming sessions. Any decline from the current levels might find a strong support near $12,600 or $12,250.
チャートを見ると、ビットコインの価格は明らかに12,200ドルと12,500ドルのサポート水準を上回る強気バイアスで取引されています。そのため、今後は13,000ドル以上に上昇する可能性が高いでしょう。現在の水準から下落する場合、12,600ドルか12,250ドル付近で強くサポートされる可能性があります。
via: Bitcoin (BTC) Price Surges 12%: Bulls Aim $13K or $13.2K
_


