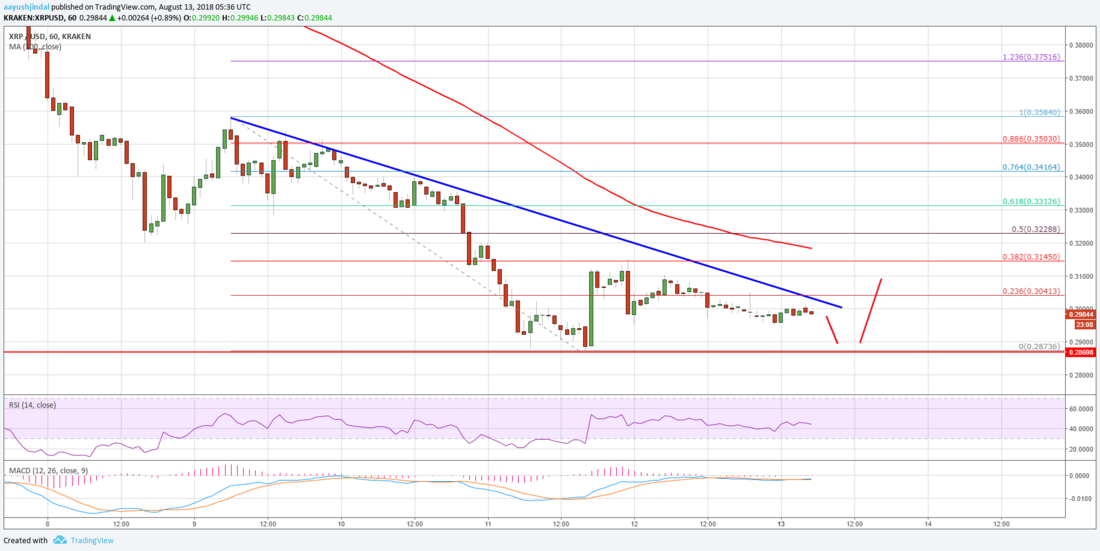
リップル (XRP) は定期的に好材料が出ているにも関わらず下落しています。XRPのチャート分析を見てみます。
仮想通貨の英語記事シリーズ、今回はこの記事を読んでいきます。
Ripple Price Analysis: XRP/USD Could Decline To $0.2600
XRPのチャート分析
This past week, there were nasty declines in Ripple price below the $0.3200 support area against the US Dollar. The XRP/USD pair even broke the $0.3000 support and traded to a new monthly low at $0.2873.
先週のリップル (XRP) は、0.3200ドルのサポートエリアを下回るほど激しく下落しました。さらに、XRP/USDペアは0.3000ドルのサポートさえ下抜け、0.2873ドルで月間の新安値を付けました。
Later, the price stared an upside correction above $0.2900 and recovered above $0.3000. There was a break above the 23.6% Fib retracement level of the last decline from the $0.3503 high to $0.2873 low.
その後、価格は上昇を始め、0.2900ドルを超え0.3000ドル以上まで回復しました。さらに、直近の下降 (0.3503〜0.2873ドル) の23.6%フィボナッチリトレースメントも突破しました。

However, the recovery found sellers near the $0.3150 level. Moreover, the 38.2% Fib retracement level of the last decline from the $0.3503 high to $0.2873 low prevented gains. The price failed to move above $0.3150 and $0.3200, resulting in a fresh downside move.
しかし、0.3150ドルの水準で売りが入り、さらに0.3503〜0.2873ドルの38.2%フィボナッチリトレースメント付近で上昇は妨げられました。価格は0.3150ドルと0.3200ドルを超えることはできず、再び下落しました。
Additionally, there is a key bearish trend line forming with resistance near the $0.3040 level on the hourly chart of the XRP/USD pair.
さらに、XRP/USDペアの時間足チャート上に、0.3040ドル付近で抵抗となる重要な下降トレンドラインが形成されています。
Looking at the chart, ripple price remains at a risk of more losses below $0.2800. Should there be a break below $0.2800, the price may perhaps decline further towards the $0.2600 level.
チャートを見ると、リップルの価格は0.2800ドル以下まで下落するリスクを抱えたままです。0.2800ドルを下抜ければ、0.2600ドルまで下落する可能性があります。
_


