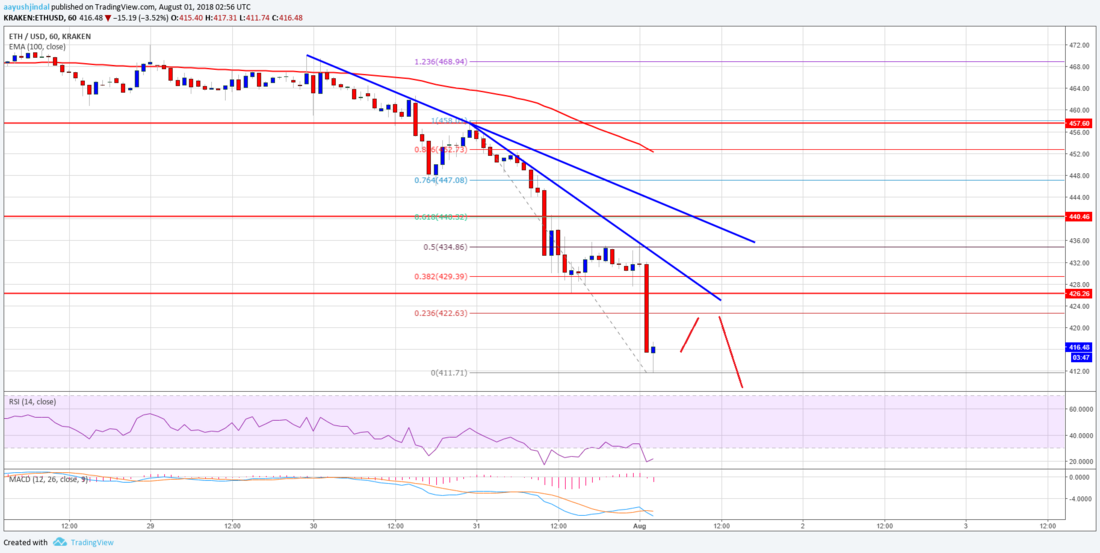
ビットコインが下落しています。ビットコインの高騰には連動しないアルトコインも、下落にはしっかりと連動するのはなぜなのでしょうか。イーサリアムのチャート分析を見てみます。
仮想通貨の英語記事シリーズ、今回はこの記事を読んでいきます。
Ethereum Price Analysis: ETH/USD Tumbles Below $430
イーサリアムのチャート分析
The ETH/USD pair extended declines below the $465 level and tumbled by more than $40. It even broke the $440 and $426 support levels to move into a bearish zone. The recent low was near $411 and it seems like upsides and recoveries are likely to be limited in the near term.
ETH/USD ペアは 465 ドルを下抜け、40 ドル以上下落しました。さらに 440 ドルと 426 ドルのサポートレベルも下抜け弱気ゾーンに入りました。直近の安値は 411 ドル付近、ここからの回復は限定的だと思われます。

On the upside, an initial resistance is near the 23.6% Fib retracement level of the last decline from the $458 high to $411 low. Moreover, there are two key bearish trend lines formed with resistance around $430 on the hourly chart of ETH/USD.
上側には直近の下降 (458〜411 ドル) の 23.6% フィボナッチリトレースメント付近に最初のレジスタンスがあります。さらに、ETH/USD の時間足チャート上には、430 ドル付近に重要な下降トレンドラインが 2 つ形成されています。
Looking at the chart, the price may perhaps correct a few points towards the $430 level. However, it is likely to face sellers and decline back below $420. Should there be a break below the $411 low, there is a risk of more losses below $400.
チャートを見ると、価格は 430 ドルに向けてわずかに回復する可能性があります。しかし、再び 420 ドルまで戻されるでしょう。安値の 411 ドルを下抜ければ、400 ドル以下まで下落する可能性があります。
_


