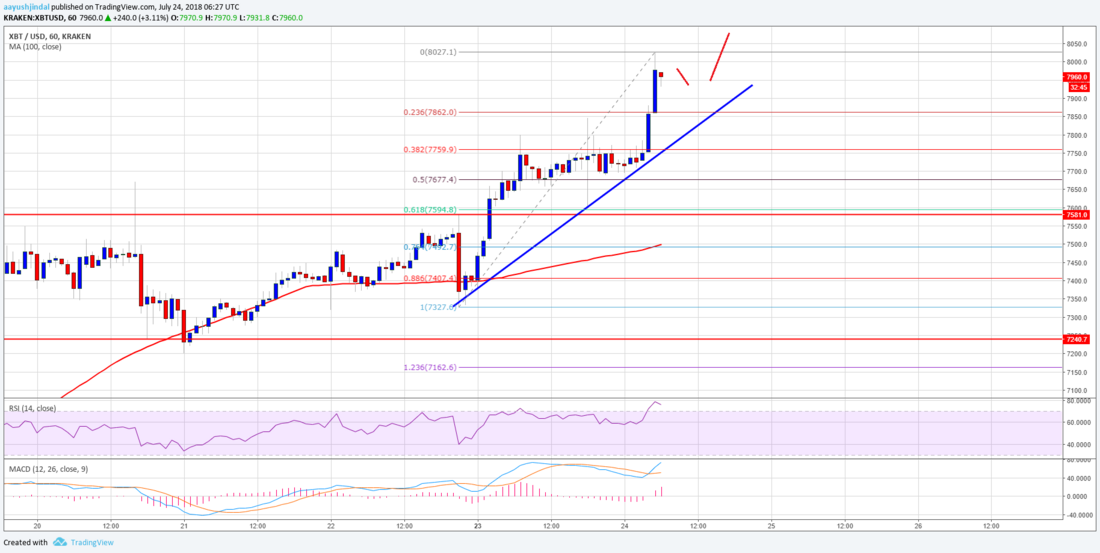
現在のビットコイン価格は 8,000 ドル前後でウロウロしています。連日高騰しているのでそろそろ押し目を作ってくれても良さそうなものですが、今後の展開はどうなるのでしょうか。ビットコインのチャート分析を見てみます。
仮想通貨の英語記事シリーズ、今回はこの記事を読んでいきます。
Bitcoin Price Watch: BTC/USD Breaks $8,000, Next Target $8,500
ビットコインのチャート分析
The BTC/USD pair did gain momentum above the $7,800 resistance and traded above the $8,000 resistance.
BTC/USD ペアは 7,800 ドルのレジスタンスを超えて勢いを増し、8,000 ドルのレジスタンスも超えました。

An initial support on the downside is near the 23.6% Fib retracement level of the last wave from the $7,327 low to $8,027 high.
下落時の最初のサポートは、直近の波 (7,327〜8,027 ドル) の 23.6% フィボナッチリトレースメントレベル付近になります。
More importantly, there is a key connecting bullish trend line in place with support at $7,850 on the hourly chart of the BTC/USD pair. Should there be a break below the trend line support, the price may trade towards the $7,770 support.
さらに重要なのは、BTC/USD の時間足チャート上で、7,850 ドルのサポート付近に重要な上昇トレンドラインがあることです。このトレンドラインのサポートを下抜ければ、価格は 7,770 ドルのサポートに向けて下落する可能性があります。
Looking at the chart, the price is showing many bullish signs above $7,850. It is likely to accelerate gains above the $8,000 level. The next resistances are near the $8,200 and $8,500 levels.
チャートを見ると、7,850 ドル以上に多くの強気シグナルが現れています。8,000 ドルを超えて勢いを加速する可能性が高いでしょう。次のレジスタンスは、8,200 ドルと 8,500 ドル付近にあります。
_


