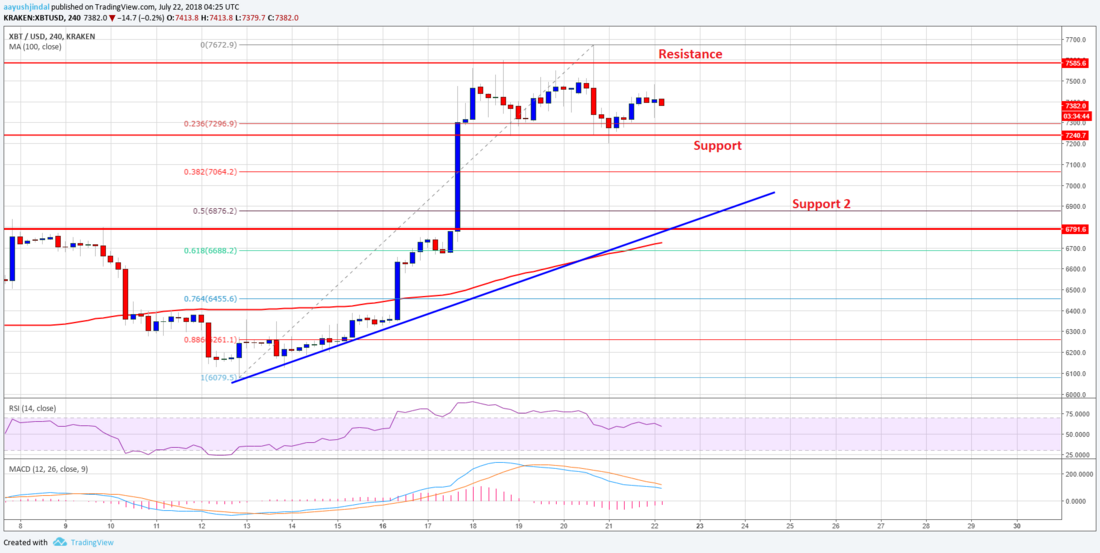
先週はビットコインが大きく高騰しました。一時的な高騰に終わるかと思いきや、大きな下落もなく現在は 7,400 ドル付近を維持しています。ビットコインのチャート分析を見てみます。
仮想通貨の英語記事シリーズ、今回はこの記事を読んでいきます。
Bitcoin Price Weekly Analysis: BTC/USD’s Next Target $8,500
ビットコインのチャート分析
The price recently tested the 23.6% Fib retracement level of the last wave from the $6,079 low to $7,672 high. However, declines were limited and the price remained well supported above the $7,250 level.
(ビットコインの) 価格は直近の波 (6,079〜7,672 ドル) の 23.6% フィボナッチリトレースメント水準を試したものの、下降は限定的で、価格は 7,250 ドル以上の水準でサポートされたままです。

It seems like there is a key range forming with resistance near $7,600 and support at $7,240. Should there be a break below the $7,240 support, the price could decline towards the next support at $7,000.
7,600〜7,240 ドルに重要なレンジが形成されているように見えます。7,240 ドルのサポートを下抜ければ、価格は次のサポートである 7,000 ドルを目指して下落する可能性があります。
Moreover, there is a major bullish trend line forming with support at $7,000 on the 4-hours chart of the BTC/USD pair. Around the trend line, the 50% Fib retracement level of the last wave from the $6,079 low to $7,672 high is also a strong support.
さらに、BTC/USD ペアの 4 時間足チャート上に、7,000 ドルでサポートする強い上昇トレンドラインがあります。このトレンドライン付近には、直近の波 (6,079〜7,672 ドル) の 50% フィボナッチリトレースメント水準も強いサポートになっています。
Looking at the chart, the price is most likely to break the $7,600 resistance for more gains towards $8,000 and $8,500. In the second case, dips remain well supported near the $7,240 and $7,000 levels.
チャートを見ると、価格は 7,600 ドルのレジスタンスを突破して 8,000 ドルと 8,500 ドルを目指して勢いを増す可能性が最も高いです。2 番目のケースとしては、7,240 ドルと 7,000 ドル付近の水準で下落がサポートされます。
_


