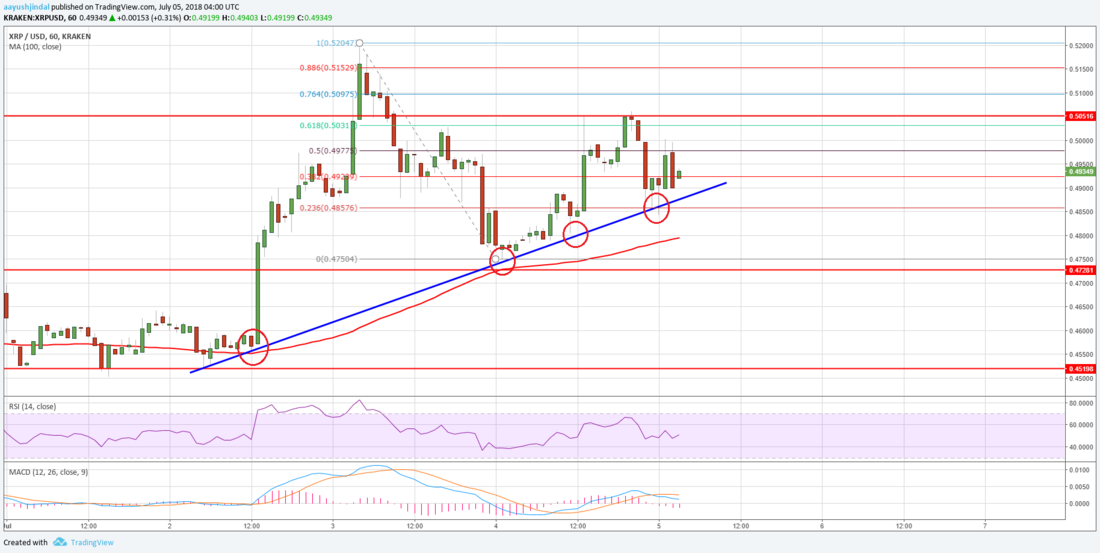
リップル (XRP) の 1 時間足チャートを見ると、この数日は安値を切り上げつつあります。XRP のチャート分析を見てみます。
仮想通貨の英語記事シリーズ、今回はこの記事を読んでいきます。
Ripple Price Analysis: XRP/USD Holding Key Support
XRPのチャート分析
There was a break above the 50% Fib retracement level of the last decline from the $0.5204 high to $0.4750 low. The XRP/USD pair traded above the $0.5000 level, but upsides were capped by the $0.5050 resistance.
直近の下降波 (0.5204〜0.4750 ドル) の 50% フィボナッチリトレースメント水準を上抜けました。XRP/USD ペアは 0.5000 ドル水準以上で取引されたものの、0.5050 ドルのレジスタンスに蓋をされました。

Moreover, the 61.8% Fib retracement level of the last decline from the $0.5204 high to $0.4750 low also acted as a resistance. The pair dipped once again, but declines were protected by the $0.4900 support zone.
さらに、直近の下降波 (0.5204〜0.4750 ドル) の 61.8% フィボナッチリトレースメント水準にも抵抗されました。価格は再び下落したものの、0.4900 ドルサポートゾーンに支えられました。
Looking at the chart, the price must clear the $0.5000 and $0.5050 resistance levels to gain traction. Above $0.5050, the price could revisit the $0.5200 zone. The overall price action is positive as long as the price is above the $0.4750 support area.
チャートを見ると、勢いを付けるには 0.5000 ドルと 0.5050 ドルのレジスタンス水準を突破する必要があります。0.5050 ドルを超えれば、0.5200 ドルゾーンに復帰する可能性があります。全体的な価格の動きは、0.4750 ドルサポートエリア以上を維持している限りはポジティブです。
_


