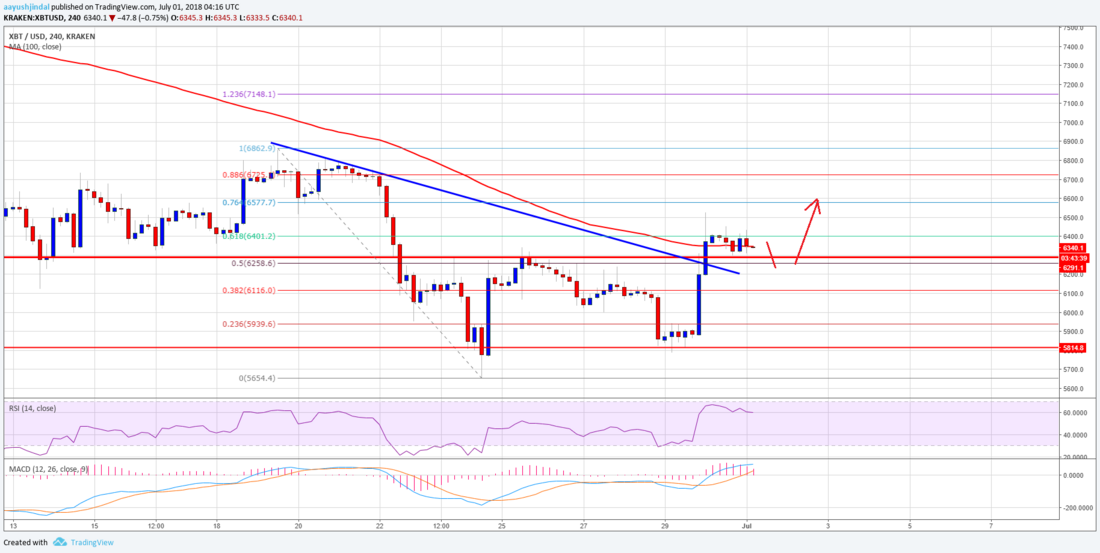
下落を続けていたビットコインは昨日反発し、下降トレンドラインを上抜けました。チャート分析を見てみます。
仮想通貨の英語記事シリーズ、今回はこの記事を読んでいきます。
Bitcoin Price Weekly Analysis: BTC/USD Showing Recovery Signs
ビットコインのチャート分析
The BTC/USD pair traded below the $5,800 level and tested the $5,650 support. A low was formed at $5,654 and the price started an upward correction.
BTC/USD ペアは 5,800 ドル水準以下で取引され、さらに 5,650 ドルのサポートも試しました。価格は 5,654 ドルで安値を付けた後、上方修正を始めました。

It cleared the 50% Fib retracement level of the last decline from the $6,832 high to $5,654 low. More importantly, there was a break above a key bearish trend line with resistance at $6,280 on the 4-hours chart of the BTC/USD pair.
直近の下降波 (6,832〜5,654 ドル) の 50% フィボナッチリトレースメント水準を超え、さらに重要なことに、BTC/USD ペアの 4 時間足チャートにおいて 6,280 ドルで抵抗となる重要な下降トレンドラインを上抜けました。
At the moment, the price is consolidating gains near the $6,400 level and the 100 simple moving average (4-hours). A break above the 61.8% Fib retracement level of the last decline from the $6,832 high to $5,654 low is needed for buyers to gain traction. The next hurdles on the upside are at $6,500 and $6,600.
現在、価格は 6,400 ドル水準と 100 期間単純移動平均線 (4 時間足) 付近で足固めをしています。買い方の勢いを増すためには、直近の下降波 (6,832〜5,654 ドル) の 61.8% フィボナッチリトレースメント水準のブレイクが必要になります。上昇の次のハードルは、6,500 ドルと 6,600 ドルになります。
今回はビットコインのチャート分析記事でした。
5 月上旬から続いていたレジスタンスラインを昨日ブレイクしました。このままトレンド転換してくれるのかどうか注目です。
_


