どうもワイです。
仮想通貨を買ってガチホするだけで簡単に儲かるのは昨年までの話でしょうか?
今回はこの記事のチャート分析をいくつかピックアップして読んでいきます。
Bitcoin, Ethereum, Bitcoin Cash, Ripple, Stellar, Litecoin, Cardano, NEO, EOS: Price Analysis, Feb. 12
※ 記事内の EMA は指数平滑移動平均線、SMA は単純移動平均線を表しています。
ビットコイン (BTC/USD)
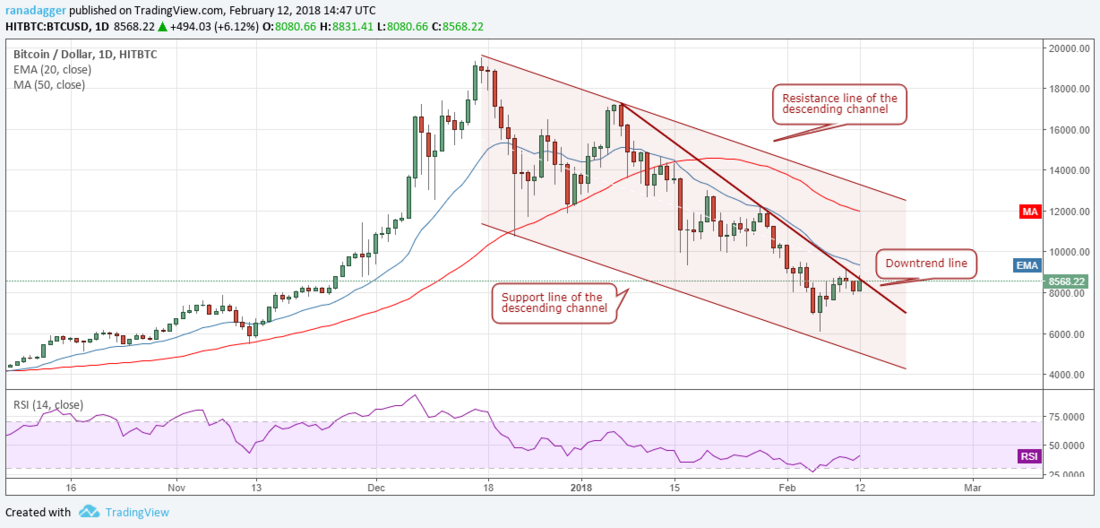
ビットコインは安値更新が予想されましたが、8000ドルを下回ることはありませんでした。

Currently, the price is likely to face resistance at the downtrend line and above it, at the 20-day EMA. We expect the $8,600 to $9,400 levels to be a real test for the bulls.
If they succeed in breaking out of this zone, a quick rally to $12,000 might take place, where it will again face resistance from the 50-day SMA and the resistance line of the descending channel.
現在では下降トレンドラインと 20 日間 EMA の抵抗線に接近しており、8600 〜 9400 ドルが上昇の正念場になると予想されます。
このゾーンを上回ることができれば 12000 ドルまではすぐに上昇し、50 日間 SMA と下降チャネルが次の抵抗線になります。
そのため 9500 ドルを上回るまで購入は控えた方が良いでしょう。ストップロスは 7800 ドル、利確目標は 12000 ドルとなります。
イーサリアム (ETH/USD)
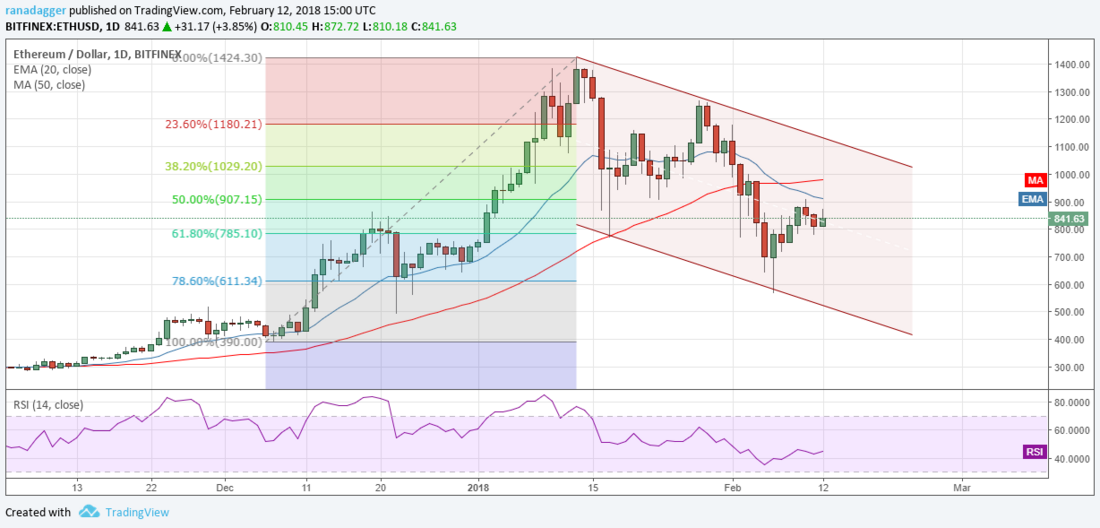
イーサリアムは 10、11 日に下降しましたが、その後再び上昇を試す展開になっています。

The ETH/USD pair is likely to face resistance at $911 from the 20-day EMA and at $980 from the 50-day SMA. Above these levels, the price may move to the resistance line of the descending channel, at about $1,050 levels.
ETH/USD は 20 日間 EMA の 911 ドルと 50 日間 SMA の 980 ドルが抵抗線になっています。これらのラインを越えると、1050 ドルの下降チャネルが次の抵抗線になります。
下は 775 ドルに強い支持線があります。
リップル (XRP/USD)
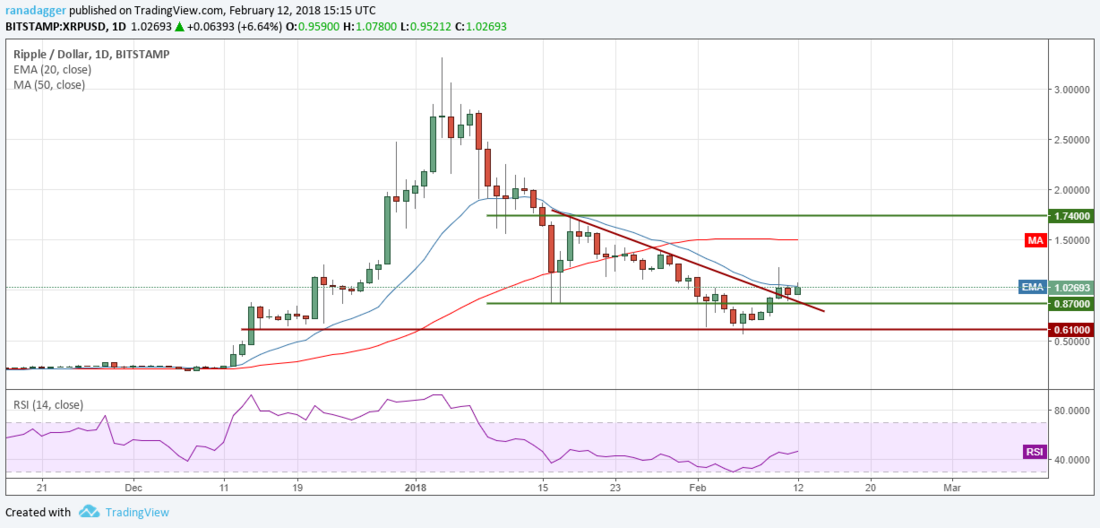
リップルは引き続き 20 日間 EMA の突破が期待されます。

On Feb. 10, the XRP/USD pair broke out of the 20-day EMA but could not sustain higher levels. Right now, it is again at the 20-day EMA. We believe that if the bulls sustain above the $1.1 levels for four hours, we can expect a rally towards the 50-day SMA at $1.5. If this level is crossed, a move to $1.74 is likely.
XRP/USD は 2 月 10 日に 20 日間 EMA を越えたものの、その水準を維持することはできませんでした。現在の価格も 20 日間 EMA 付近にあります。
1.1 ドル以上の水準を 4 時間維持することができれば、50 日間 SMA の 1.5 ドルまで上昇が期待できます。これを越えることができれば次の目標は 1.74 ドルになります。
ライトコイン (LTC/USD)
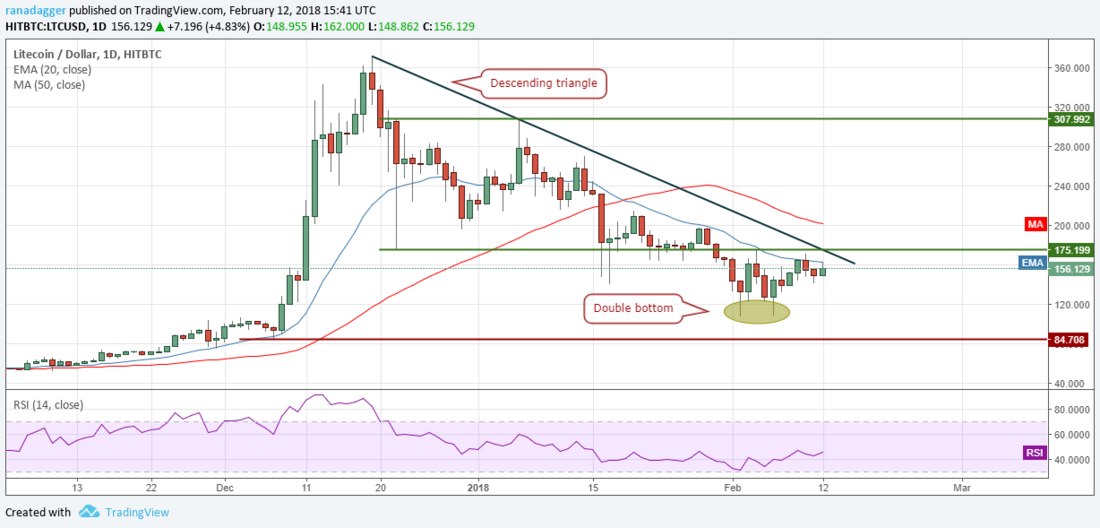
ライトコインはこの 3 日間、20 日間 EMA のハードルを突破できずにいます。

If the price breaks out of $175, it will clear the resistance from the 20-day EMA, the downtrend line, and the horizontal line.
We believe that this is a significant development. That’s we reiterate our recommendation to initiate long positions if the LTC/USD pair holds above the $178 levels for four hours.
価格が 175 ドルを上回れば抵抗線 (20 日間 EMA、下降トレンドライン、水平線) を抜けることになります。
これは大きな前進です。178 ドル以上の水準を 4 時間維持することができれば、改めてロングポジションを取ることをお勧めします。


